In the beginning. And He said, “Let there be Light” and there was light.
Some millennia later, man invented the photovoltaic (PV) cell to convert that light (from the sun) into electrical energy. And this electrical energy has some properties that are not like the properties of other common forms of electrical energy. Old Pros may skip this article, but you never know when you might pick up a new tidbit or two.
The Origin of PV Currents. From an electrician’s, PV installer’s, or electrical inspector’s point of view, the currents start at the PV module—at least for the dc solar part of the system. Those interested in learning about the photovoltaic effect of converting photons from the sun into electrons in the PV cell/module should take a physics course at a local community college, take an on-line course, or get a good book on physics.
Electricity from common sources such as household alternating current (ac) at 120 volts and 60 Hz, or the output of the auto battery at 12 volts direct current (dc) is relatively stable. In comparison, the output (voltage and current) of a PV cell, PV module, or PV array varies with the sunlight on the PV system, the temperature of the PV modules, and the load connected to the PV system.
A single silicon PV cell will produce about 0.5 volts under an optimum load. There are other photovoltaic materials (e.g., cadmium telluride, copper indium selenide) used in PV modules that will have different characteristics. The current will depend largely on the size of the cell (bigger is better) and the intensity of the sunlight on the cell (known as irradiance). Cells are connected in series, and sometimes in parallel, to increase voltage and sometimes current and this connection of cells forms a PV module (not to be confused with a solar panel which generally produces hot water). PV modules used in recent utility-interactive PV systems have generally had 60, 72 or 96 cells. Rated power outputs for a single module used in PV power systems have ranged from about 100 watts to 325 watts and more when evaluated under a set of standard test conditions.
Standard Test Conditions. PV modules are rated for power, voltage and current output when exposed to a set of standard test conditions. Those ratings are printed on the back of each module and are available in data information sheets for each particular module. The standard solar intensity (called irradiance) is set at 1000 watts per square meter (W/m2). This is an international constant and is near the average value of irradiance at sea level on the surface of the earth. Modules are also rated at a standard module/cell temperature of 25 degrees Celsius (C) [77 degrees Fahrenheit (F)]. These two values of irradiance and temperature are referred to as standard test conditions (STC). When the module is exposed to these standard test conditions, and connected to the correct load, the module will produce the rated power at a maximum power point voltage (Vmp) and with a maximum power point current (Imp).
During the evaluation of the safety of the module, performed by a nationally recognized testing laboratory (NRTL), leading to the module being listed as required by National Electric Code (NEC) 690.4(D), the ratings of the module are also verified to be within some percentage of the label values. The tolerance on the label values is usually 10 percent but may be as low as 3 percent. A PV module, as a current source, not voltage source, can be short-circuited indefinitely without damage. And, as will be shown in subsequent articles, the wiring, the switchgear and the overcurrent protection are designed in a way that will allow entire PV arrays to be short-circuited without damage.
The Real-World Environment. Unfortunately, or fortunately depending on your point of view, the sunlight irradiance and the temperatures are not usually at the STC values. At night, there is no output from the PV module, and shadows, clouds, rain, haze, smoke and dust will all reduce the solar intensity and the lower the temperature of the module and the power output will be below the STC rating. And, on clear, sunny, cold days the PV module may produce more than its rated current, voltage and power for three hours or more; usually for a period around solar noon—not to be confused with local standard time noon. Because of the significant variation in the PV system output due to environmental conditions, a single measurement of a PV system voltage or current is not particularly useful. To see how the output of a PV module, a series-connected string of PV modules or even an entire PV array performs under various environmental conditions, an IV curve is made of the module or system in question.
Current and Voltage Measurements — The IV Curve. Measuring the module or array output under short circuit conditions will allow measurement of the short-circuit current (Isc), which will be used in PV system sizing and in many Code calculations. A voltage measurement under short-circuit conditions will yield zero (0) volts.
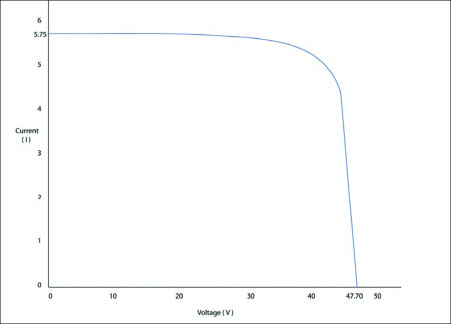
If a voltmeter is used to measure the voltage output of a PV module or array that is not connected to any load, the voltage obtained will be the open-circuit (no load) voltage (Voc). A current measurement would be zero (0) for this open-circuit condition. If simultaneous voltage and current measurements are taken on a PV module or a PV array and these measurements plotted for various loads, a graph that shows the electrical characteristics of a PV module could be shown. The graph would have current (I) on the vertical axis and voltage (V) on the horizontal axis. This graph or plot for a single PV module is shown in figure 1 and is called an IV curve. Similar curves appear in data sheets for PV modules and are made in the laboratory on PV modules or in the field on modules, strings or PV arrays.
P = V x I
The point to the right on the horizontal axis is the open circuit-voltage (Voc) and the current at this point is zero (0). On the vertical current axis, the curve intersects the axis at the short-circuit current (Isc) where the voltage is zero.
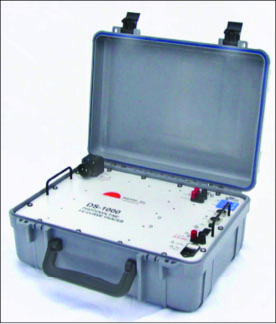
A device called an IV curve tracer (photo 1) is used by the module manufacturers, the testing laboratories, or by the larger PV installation organizations under a constant solar irradiation and at a constant temperature to automatically record the voltage and current data for these IV curves. The irradiance and module temperature are also recorded during the very short time (a second or two or less) period required to take the data.
Power Equals Voltage Multiplied by Current. Each point on the IV curve represents a value of voltage and a value of current at a particular load. Multiplying the voltage (V) by the current (I) will calculate the power (P) produced by a module and delivered to the load.
P = V x I
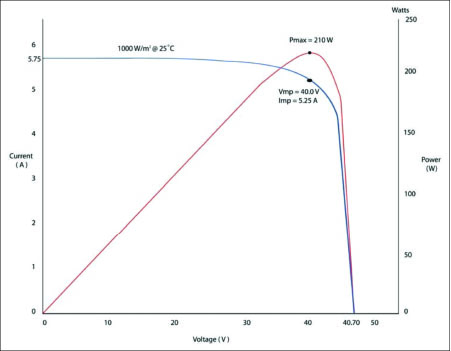
From this relationship, it can be seen that the module delivers no power at either the open-circuit voltage point or at the short-circuit current point because one of the factors of power is zero at these points. However, if other points are examined on the curve (producing power into different loads), it will be noted that the power is not zero for these points. If the power output curve is added to the IV curve, the graph shown in figure 2 is obtained that includes the IV curve in blue and the power curve in red. The horizontal axis for the combined graph is still volts, but the vertical axis (on the right) for the power curve is now marked watts. The curve for power shows that it reaches a peak for some load between Isc and Voc and this point is called the maximum power point (Pmp). Associated with the maximum power point are a maximum power point voltage (Vmp) and a maximum power point current (Imp).
It should be noted that the output voltage of a PV module is not constant and varies with the load. This output is changed by several different external environmental conditions in addition to the connected load.
Current Varies with Sunlight Intensity. The current output of a PV module is directly proportional to the intensity (irradiance) of the sunlight falling on it. The rated currents (both Isc and Imp) are output at the standard test condition irradiance of 1000 W/m2. However, PV modules are exposed to irradiance values from 0 (night) to 1500 W/m2 (cloud, water, snow, or sand enhanced) and the current follows changes in the intensity of the sunlight. A 10% reduction in the irradiance value will result in a 10% reduction in Isc and Imp. However, the open circuit voltage (Voc) is relatively unchanged with small variations in irradiance. Figure 3 shows the IV curves for a PV module as the sunlight intensity varies from 1000 W/m2 down to 500 W/m2. As can be seen, the Isc changes in direct proportion to changes in irradiance but Voc and Vmp do not vary nearly as much.
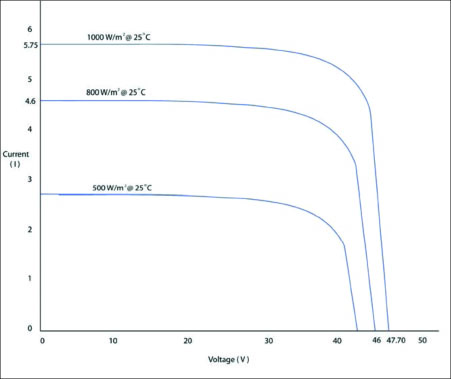
This is a significant fact. The voltage on a PV module or PV array will generally be present at very low levels of light such as at dawn or dusk. PV arrays can have hundreds of volts on the wiring at dawn and dusk even when the sun does not directly illuminate the fronts of the modules. Hazardous voltages on exposed terminals in dc combiners, disconnects, and the input terminals to inverters will be present.
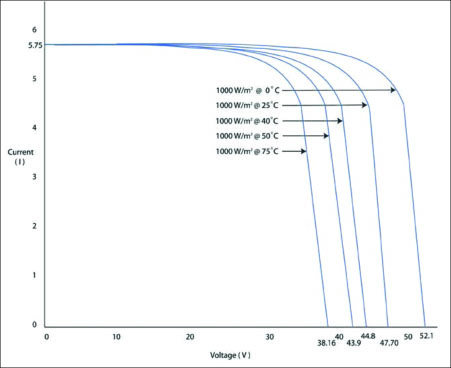
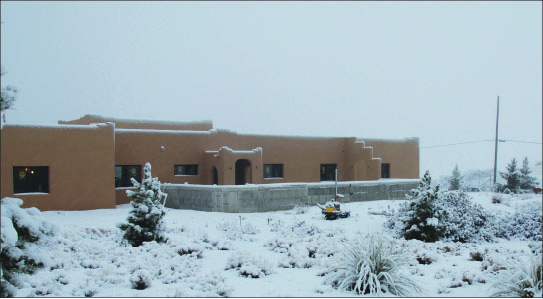
A second variation in the module output and the IV curve is caused by temperature. Module current is relatively insensitive to temperature, but both the Voc and Vmp voltages will be affected. In crystalline silicon PV modules, Voc varies inversely with temperature at about 0.5% per degree Celsius and peak-power voltage (Vmp) varies inversely about 0.4% per degree Celsius. Figure 4 shows the relationship and as temperature goes down, voltage increases and as temperature increases, the voltage decreases (photo 2).
Turning Off the PV System. The PV modules in utility-interactive systems are connected in series and the open-circuit voltage may approach 600 volts (dwelling), 1000 volts (commercial), and 1500 volts (utility-scale) in cold weather. The only way to effectively turn off all electricity from a PV module or a PV array is to cover it with an opaque material. Working at night on the array wiring is an option, but worker safety would be a concern, and lightning illuminating the distant sky has been known to illuminate the array enough to produce electric shocks. High intensity lighting used by the Fire Service may also create unsafe voltages in the PV array. Of course, the NEC (2014 and 2017) requires that all PV arrays mounted on buildings be equipped with a PV Rapid Shutdown System (PVRSS) (690.12) and that will be discussed more fully in a future article.
Voltage and Current Variations—Why and How to Deal with It
In the PV design process, the array output must be matched to the utility-interactive inverter input. The typical inverter will require voltages from several hundred to a thousand volts or more to operate efficiently. PV system designers and installers want to keep the voltage up and the current down to minimize conductor sizes and costs. As noted previously, the module voltage and current outputs are not constant, and the system designer must first ensure that in cold weather conditions, the array output voltage will not exceed the dc input voltage rating of the inverter, the conductor insulation, or other connected equipment. This limit will frequently be as high as 600–1500 volts depending on the system design and the equipment being used. In a similar manner, discussed below, all conductors, overcurrent devices, and switchgear must be able to handle the array output current under worst-case conditions of high sunlight intensity. Exceeding the voltage rating on inverters, conductors, switchgear or other equipment would be a Code violation and has been known to damage such equipment. See NEC 110.3(B).
Early pioneers in PV including PV module manufacturers, Jet Propulsion Laboratories (space programs), Underwriters Laboratories (UL), and the National Fire Protection Association (NFPA) realized that because of these variations in the output of the PV module, special consideration would need to be made to address the electrical installation requirements of these systems in the NEC.
UL Standard 1703, Standard for Flat-Plate Photovoltaic Modules and Panels, was written to establish the safety requirements (mechanical and electrical) that PV modules would be required to meet. Until about 2012, requirements in module instruction manuals were written that modified the values of the standard test condition parameters printed on the back of the module. In recent editions of the standard, the safety requirements defer to the NEC to establish how the PV module outputs are to meet electrical safety requirements in the system installation.
These modifications to normal Code requirements dealt with the fact that the sunlight intensity in many parts of the country could exceed the standard test condition of 1000 W/m2 for three hours of more on numerous days throughout the year. As noted above, the PV module/string/array can deliver more than rated current and rated voltage as environmental conditions vary.
Three hours per day represents continuous duty in the Code and it was decided in the early days of PV systems that the Code calculations for PV systems should be based on worst possible outputs and that those outputs would be considered to be continuous 24 hours per day / 7 days per week / 52 weeks per year and not vary on a daily cycle with the sun. Therefore, all voltages and currents used in the calculations for PV systems in Code are adjusted from the standard test condition measurements in a way that ensures that the electrical system will meet Code requirements for safety and that all the equipment will be operated within limits established by both the Code and UL Standards.
Adjustments — Open Circuit Voltage. As noted previously, the open-circuit voltage (Voc) varies inversely with temperature. The instruction manuals for PV modules made before 2012 had the following statement or its equivalent:
“Multiply the open-circuit voltage (Voc) marked on the back of the module by 125% before applying any requirements established by the NEC.”
For crystalline silicon, a factor of 125% on Voc represents the open-circuit voltage of a module at about –40°C (-40°F). Temperatures lower than -40° are found in some parts of the country and further adjustments to Voc may have to be made where these temperatures are expected.
This 125% factor associated with a temperature of -40°C (-40°) is a conservative safety factor. However, that 125% multiplier requirement is no longer in the PV module instruction manuals for modules made after 2012 and NEC requirements now establish the various correction factors to be used during the installation. Table 690.7 in the NEC is also somewhat conservative, and it shows the open-circuit voltage multiplication factors for various low temperatures. The NEC allows this table to be used or the open-circuit voltage temperature coefficients from the module data sheet may be used for the calculation of Voc at low temperatures.
PV system designers and installers will try to use as many PV modules in a series string as possible because when the temperatures are high, and the module temperatures are higher, the open-circuit voltage drops and may become too low for the inverter to turn on or to operate properly. It is important that the AHJ require that the PV installer/system designer indicate on the plans that an appropriate expected low temperature has been used for the installation location and that the calculated PV system Voc at this low temperature does not exceed the voltage rating of the inverter or any associated equipment in the dc portion of the system. The author has damaged an inverter rated for 600 volts on the dc input with an input voltage of 604 volts.
Current Corrections—Another 125 percent. As noted above, the module, string, or array output current varies directly with irradiance and while the modules are rated at a standard test condition of 1000 W/m2 , the irradiance on clear sunny days may exceed that value significantly for three hours or more. The author has measured irradiance values of 1190 W/m2 for a period of four hours on an installed PV system. To keep conductors, overcurrent protective devices, switchgear and other equipment that has to carry the output of a PV system from being used at current levels that exceed their rating, the NEC in Section 690.8 requires that the STC rated short-circuit current be multiplied by a factor of 125%. This new value of current is called the maximum current and is used in most of the other calculations in the Code involving PV dc currents. This 125 percent factor is equivalent to an irradiance of 1250 W/m2, a value of irradiance that is higher than the PV array should ever experience for three hours or more. Cloud, water, sun, and snow enhanced irradiances are higher (up to 1500 W/m2), but these are transient in nature and last only a few minutes before the conditions (sun angle, cloud movement) that caused them to change. The Code does not address these conditions directly, but the PV system designer should keep them in mind.
Summary. PV modules as current sources driven by sunlight have different electrical characteristics from other electrical sources. The output of the PV module is significantly affected by environmental conditions including irradiance and temperature. UL Standards for the PV module and the requirements of the NEC have been written to accommodate the output variations of the PV module to ensure that it can be safely integrated into residential, commercial and utility-scale electrical systems.
The Southwest Technology Development Institute web site maintains a PV Systems Inspector/Installer Checklist and all copies of the previous “Perspectives on PV” articles for easy downloading. A color copy of the latest version (1.93) of the 150-page, Photovoltaic Power Systems and the 2005 National Electrical Code: Suggested Practices, written by the author, may be downloaded from this web site: https://swtdi.nmsu.edu/codes-standards/