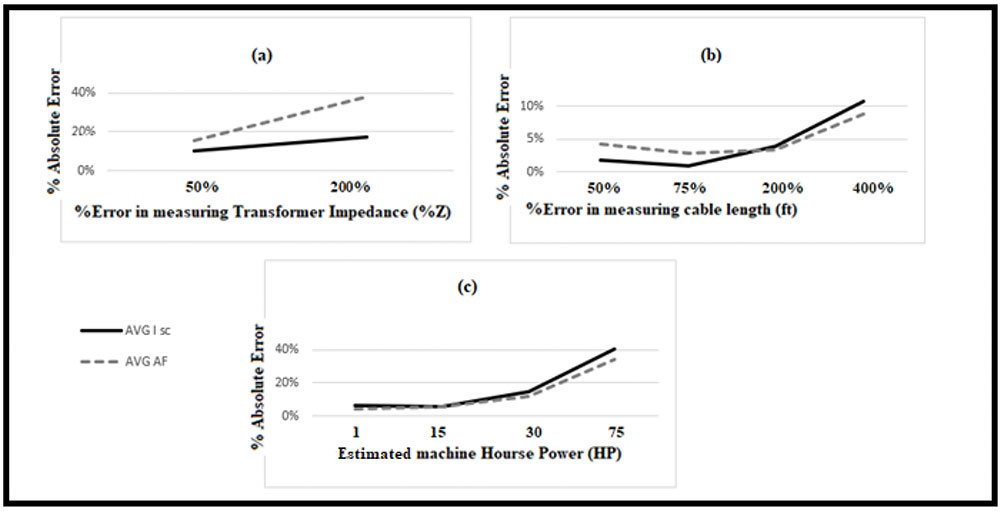
Figure 8. Graphical representation summarises the data in Tables 2,3 and 4, using the three cases in Figure 7. Note that, the x-axis in Sub-Figures (a) and (b) are %error, while the x-axis in Sub-Figure (c) contains HP values.
Figure 8. Graphical representation summarises the data in Tables 2,3 and 4, using the three cases in Figure 7. Note that, the x-axis in Sub-Figures (a) and (b) are %error, while the x-axis in Sub-Figure (c) contains HP values.