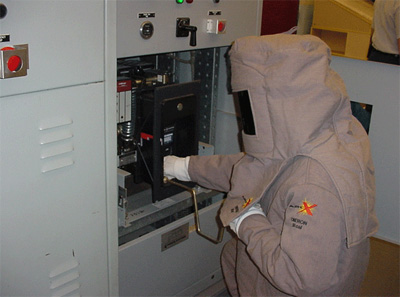
 What started as a slow drip a decade ago has turned into something more like a tidal wave. I’m not talking about a leaky faucet or a failing dam; I am referring to arc-flash hazard calculation studies. Years ago, only a few mostly larger companies performed these complex studies. Then little by little, the “drip” of studies turned into a steady stream and today, the arc-flash hazard calculation study (AFHCS) has become an integral part of many electrical safety programs.
It was ten years ago that IEEE 1584, known as “IEEE Guide for Performing Arc Flash Hazard Calculations,” was first introduced. This landmark document defines equations and methods that have become key components of the AFHCS.
Although the “drip” might have started in the United States, the “tidal wave” has now washed across the entire globe and arc-flash studies are becoming more common in other countries as well.
Arc-Flash Hazard Calculation Study
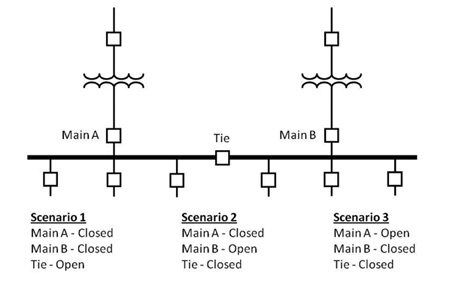
Figure 1. A simple line diagram can be used to define different operating scenarios
When you first attempt to perform the arc-flash study, it can seem quite intimidating. Even with the help of commercially available computer programs, knowing what data to use, how to model the system and how to interpret the results can leave you scratching your head.
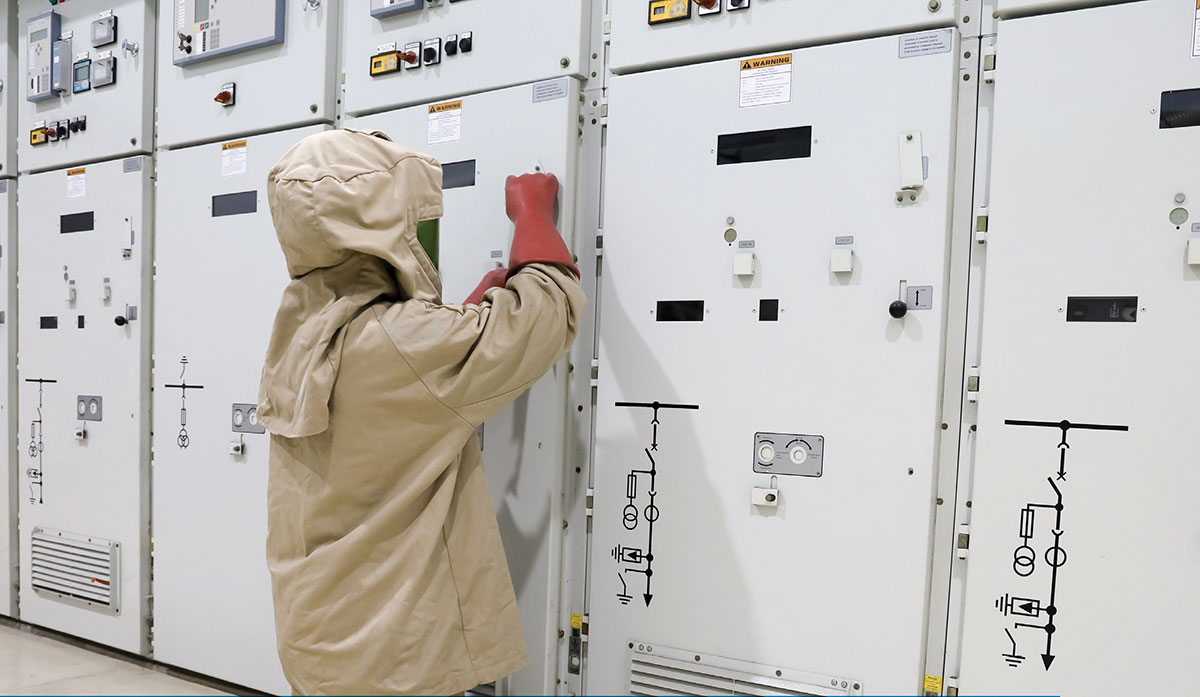
The concept of the study is really quite simple. At each piece of electrical equipment that is part of the study, calculations are performed to determine the prospective incident energy that could be available to a worker during an arc flash. The magnitude of incident energy, given in terms of calories per square centimeter (cal/cm2), is used to define the severity of the arc flash as well as to determine which protective clothing and personal protective equipment (PPE) to use.
In addition to the incident energy calculations, a distance known as the arc-flash boundary (AFB) must also be determined. The AFB defines the distance from a prospective arc source where the incident energy drops to 1.2 cal/cm2. This level of incident energy can produce the onset of a second degree burn which is also called a “just curable burn” and is the threshold where protection is required. NFPA 70E requires the use of properly rated protective clothing and PPE when people are working within this boundary and an arc-flash hazard is present.
IEEE 1584 Guide for Performing Arc Flash Hazard Calculations
IEEE 1584 is the most commonly used method for calculating incident energy and the arc-flash boundary. The IEEE equations were empirically derived from hundreds of arc-flash tests and are valid for systems operating from 208 volts up through 15 kV with short-circuit currents ranging from 700 amps up through 106,000 amps.
Even though many arc-flash events begin with contact from only one phase to ground or one phase to another phase, it is possible that the conducting plasma that develops from the arc could quickly engulf the other phases and escalate into a larger three-phase arc flash. As a result, to be conservative, the IEEE equations assume the arc flash involves all three phases.
Where to Begin?
Although the arc-flash hazard calculation study can appear to be overwhelming, it can be more easily managed if the entire process is broken down into smaller simpler steps. Attempting to look at the entire study process all at once, especially if this is your first one, can bring on a feeling of panic. Take it one step at a time!
Step One – Data Collection
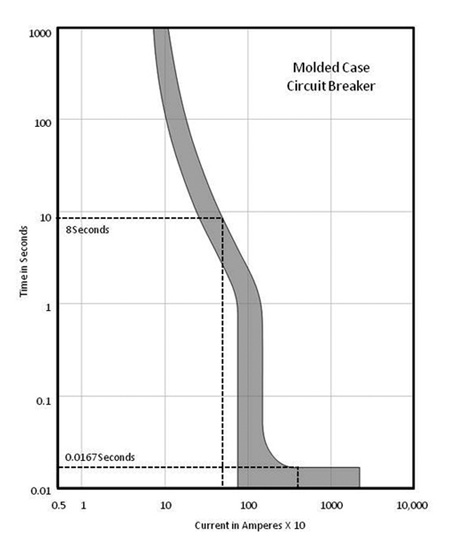
Figure 2. Time-current curves help define the arc flash duration
To accurately model the power system under study, a significant amount of data is required. Depending on the system’s size, age, and complexity, as well as what data is readily available from previous studies and documents, this effort could require a significant amount of manpower.
Data requirements typically include information about the utility company’s available short-circuit current as well as their protective devices. Also required is impedance data from components such as conductors and transformers as well as from other sources of short-circuit current such as motors and generators. Protective device data, the type of equipment such as whether it is a panel, switchgear or switchboard, as well as other information such as working distances and gap distances, give you an idea of how much effort will be required.
Step Two – Single-Line Diagram and System Modeling
An up-to-date single-line diagram is also necessary to document and organize the data. If a single line already exists, it must be verified and updated with any changes that may have occurred over time. Where a single-line diagram does not already exist, one will need to be created.
Many power systems can be operated under different configurations such as a bus tie open or closed, or operating under normal source conditions or from an emergency generator. This can result in a different level of incident energy depending on how the system is configured at the time. The single-line diagram can be used to assist in defining different operating scenarios as shown in figure 1. In addition to the normal configuration, “what if” scenarios may also be necessary to determine whether any of the alternate configurations could produce results worse than the base case.
Step Three – Arcing Short-Circuit Current
IEEE 1584 provides equations for calculating the “arcing” short-circuit current based on using a known “bolted” short-circuit current obtained from a traditional short-circuit study. The “bolted” condition means that no additional impedance is at the point of the fault. It acts as if there is a bolted or welded connection. The “arcing” current results when the short-circuit current jumps across an air gap, typically created from a conductor or conducting object either melting or being blown back. The additional impedance of the air gap means the “arcing” short-circuit current will always be less than the “bolted” value.
Step Four – Arc Flash Duration
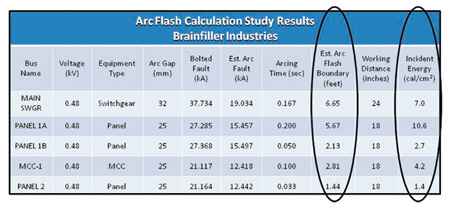
Figure 3. Table of arc flash study results
Incident energy is not only dependent on the arcing short-circuit current, it is directly dependent on the duration of the arc flash. The longer the arc flash lasts, the greater the total incident energy exposure. Normally, the duration is defined by how long it takes a protective device upstream from the arc flash to operate. For this evaluation, time current curves such as illustrated in figure 2 are used. The calculated arcing short-circuit current is located on the horizontal axis of the graph. Drawing a vertical line, the point at which the current value intersects the protective devices time current curve defines the duration in seconds.
Step Five – Incident Energy
Incident energy calculations are used to determine how much energy can reach a person located at a specific distance, known as the “working distance,” from the source of the arc. The specific working distance used depends on the type of equipment and is typically defined as either 18, 24 or 36 inches, although other distances may also be used.
The total incident energy available during an arc flash is a direct function of the short-circuit current flowing through the air gap and the time it takes an upstream protective device to clear the fault. In general, the greater the short-circuit current, the greater the incident energy. However, this is not always the case.
It is a common belief that the greater the available short-circuit current is at a particular location, the more damage can occur. When it comes to evaluating a protective device’s interrupting and withstand capability, this is a correct statement. However, in the case of an arc flash, it is quite possible that a lower short-circuit current could cause the upstream protective device to take longer to operate and actually increase the overall incident energy exposure.
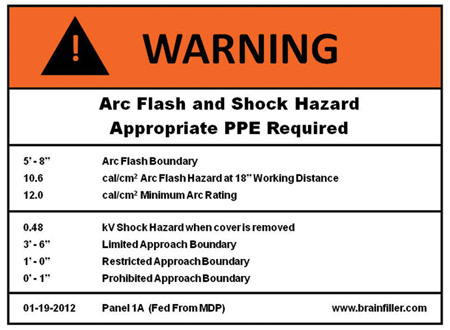
Figure 4. The arc flash warning label contains very important information
The incident energy is also dependent on whether the arc flash occurs in open air or in a box type of environment such as an equipment enclosure. When an arc occurs in open air, energy can radiate spherically in all directions, and less incident energy is concentrated towards the worker. However, when an arc occurs in a box, the energy is focused out of the opening towards the worker, resulting in much higher incident energy.
Step Six – Arc-Flash Boundary
The arc-flash boundary is considered to be the minimum distance from a potential source of an arc flash where the incident energy falls to 1.2 cal/cm2. Since this energy level is the threshold of a second degree burn, it is the minimum distance that people not wearing appropriate PPE should be located when an arc-flash hazard exists.
The results of an arc-flash calculation study will often yield many different AFBs. This is based on each piece of equipment’s location and unique characteristics as illustrated in the results shown in figure 3. With so many different boundaries there is a potential of causing confusion.
Although the individual calculated values are often used, a simpler approach to reduce the confusion is to adopt a more standardized AFB. This requires reviewing the various AFB results and adopting the largest boundary within reason. Reviewing the results of the AFHCS shown in figure 3 indicates the largest AFB is 6.65 feet at the main switchgear. Rounding this value up to 7 or 8 feet could provide the basis for a standardized boundary that can be used at all locations. Remember the AFB does not directly affect the person performing the work. It only affects the person that is not performing the work, i.e., defining how far they need to be from the potential arc flash source.
The term “within reason” is used because it is possible to have an unusually large AFB that may not be realistic. The existing IEEE 1584 equations use a protective device’s clearing time as one of the many input variables. If the arcing short-circuit current is low, a protective device’s time current characteristic may indicate an unusually long clearing time, perhaps tens of seconds resulting in an unusually large AFB calculation.
Step Seven – PPE Selection
Arc-rated (AR) clothing and PPE are designed to protect the worker against the thermal energy exposure from an arc flash. To properly select protective clothing and equipment, the arc rating of the protection must be sufficient for the calculated incident energy.
Similar to the situation where a study has many different arc flash boundaries, each piece of equipment will have its own calculated incident energy. The simplest approach for selecting the protective clothing and equipment is to determine the largest incident energy value within reason and select a standard arc rating based on this value. For the study results in figure 3, 12 cal/cm2 would be sufficient based on the largest incident energy value of 10.6 cal/cm2 at Panel 1A. Sometimes there may be a few locations where the incident energy is greater than the arc rating that was selected. In those cases, protection with a higher arc rating can be necessary.
Step Eight – Arc Flash Warning Labels
Presently there are only minimal requirements regarding the content and format of arc flash warning labels. ANSI Z535 provides guidance about signal words such as Caution, Warning and Danger as well as the appropriate colors to use. The National Electrical Code and NFPA 70E both require the use of labels to warn about the potential arc flash hazard. The 2012 edition of NFPA 70E takes it further and requires specific information to be listed on the label. According to NFPA 70E 130.5(C), the label must contain at least one of the following:
- Available incident energy and the corresponding working distance
- Minimum arc rating of the clothing
- Required level of PPE
- Highest hazard/risk category (HRC) for theequipment
In addition, the nominal system voltage and arc-flash boundary must also be listed on the label. This information is critical so the qualified person performing the work can properly address the hazards. The earlier 2009 edition of NFPA 70E had fewer requirements for arc-flash labels so the new 2012 edition allows an exception for labels created prior to September 30, 2011, as long as they have the available incident energy or level of PPE listed.
Many different label formats have evolved with some preferring to use only the minimum information required while others prefer to include additional data. Although not officially required, the additional information may include items such as the limited, restricted and prohibited approach boundaries found in NFPA 70E as well as other information illustrated in figure 4.
Step Nine – Report and Recommendations to Reduce Incident Energy
After the arc-flash hazard calculations have been completed, a formal report should be developed that documents as a minimum, the data used, study assumptions, calculation results, PPE recommendations, single-line drawing, a description of the study procedure, as well as recommendations on how to further reduce incident energy exposure.
Recommended solutions for reducing incident energy can be divided into two categories depending on the cost and ease of implementation. The first category could contain low-cost or no-cost solutions, such as changing overcurrent device settings. The second category could contain changes requiring some level of expenditure in order of priority based on their costs and benefits.
Electrically Safe – The Best Step
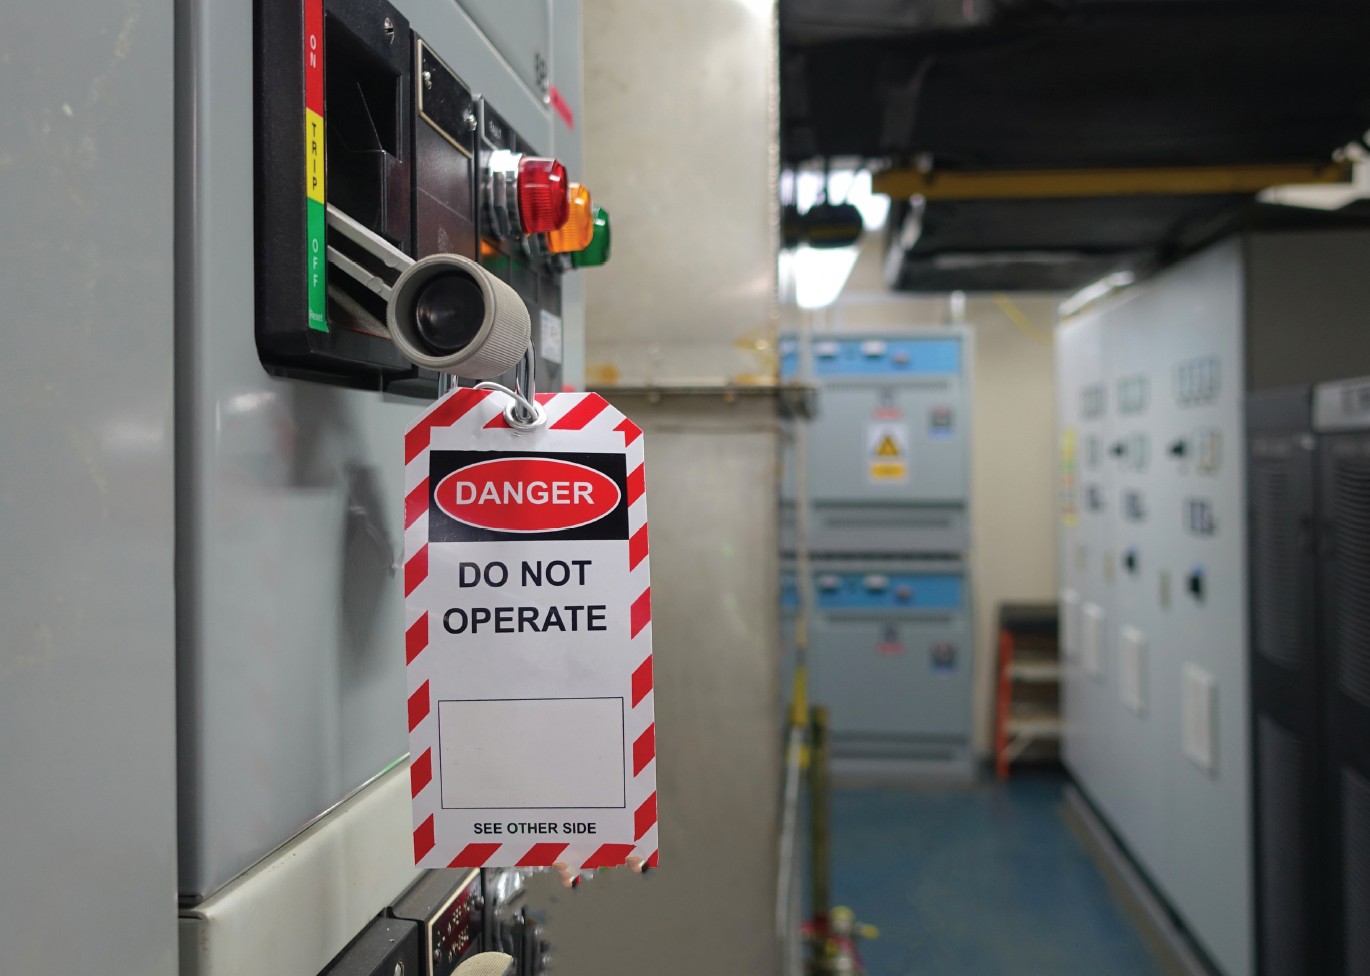
As complex as an arc-flash study could be, breaking it down into smaller steps can go a long way towards making it more manageable. However, the best step that can be taken to protect the worker against electrical hazards is to only permit work on equipment that is placed into an electrically safe condition. This means it has been de-energized, locked out, tested for the absence of voltage and safety grounds installed if necessary. Only then is the system truly safe to work on.
Copyright © 2012 Brainfiller, Inc.





Find Us on Socials