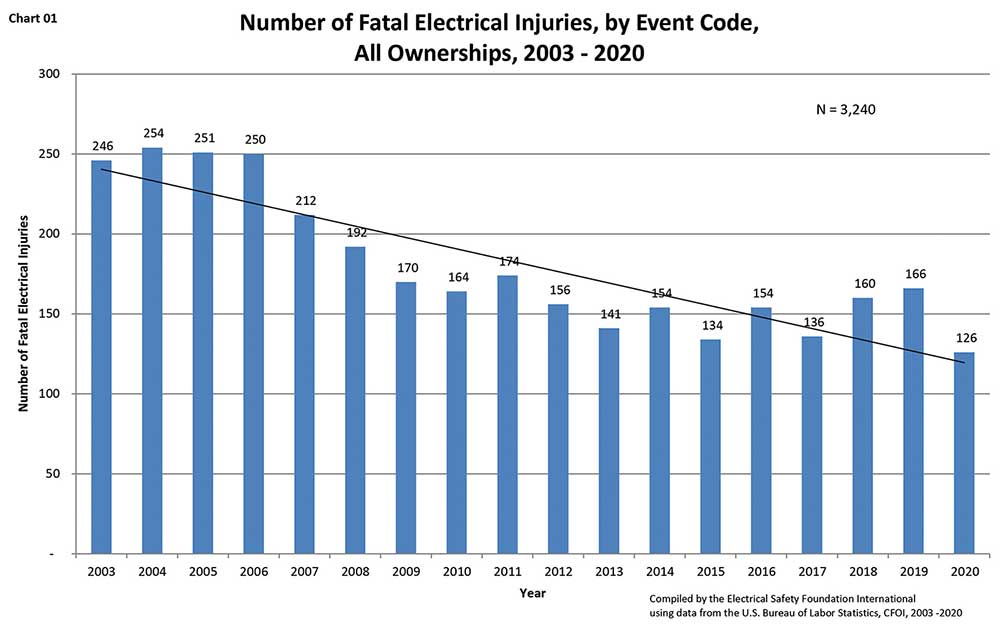
Using the U.S. Bureau of Labor Statistics (BLS) Census of Fatal Occupational Injuries (CFOI) and Survey of Occupational Injuries (SOII), each year the Electrical Safety Foundation International (ESFI) collects and publishes information on fatal and nonfatal occupational electrical injuries to esfi.org. The most recent data covers incidents from 2003 to 2020 but focuses heavily on data from 2011 to 2020.
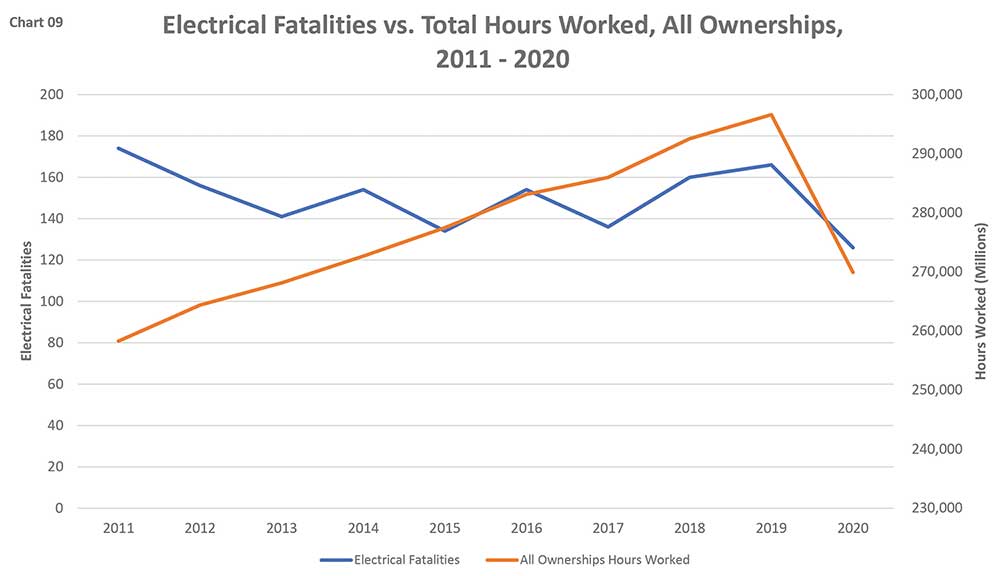
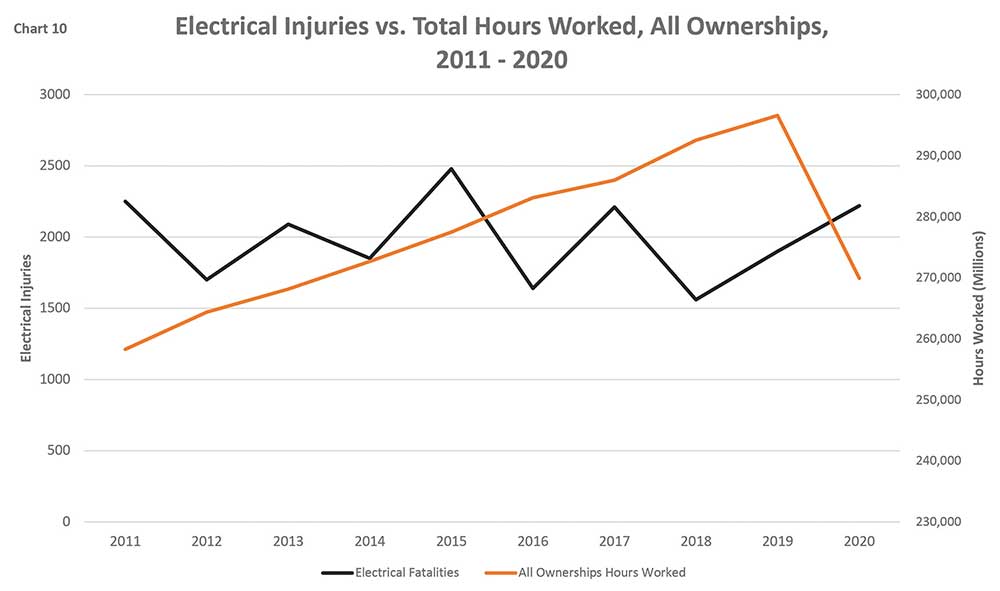
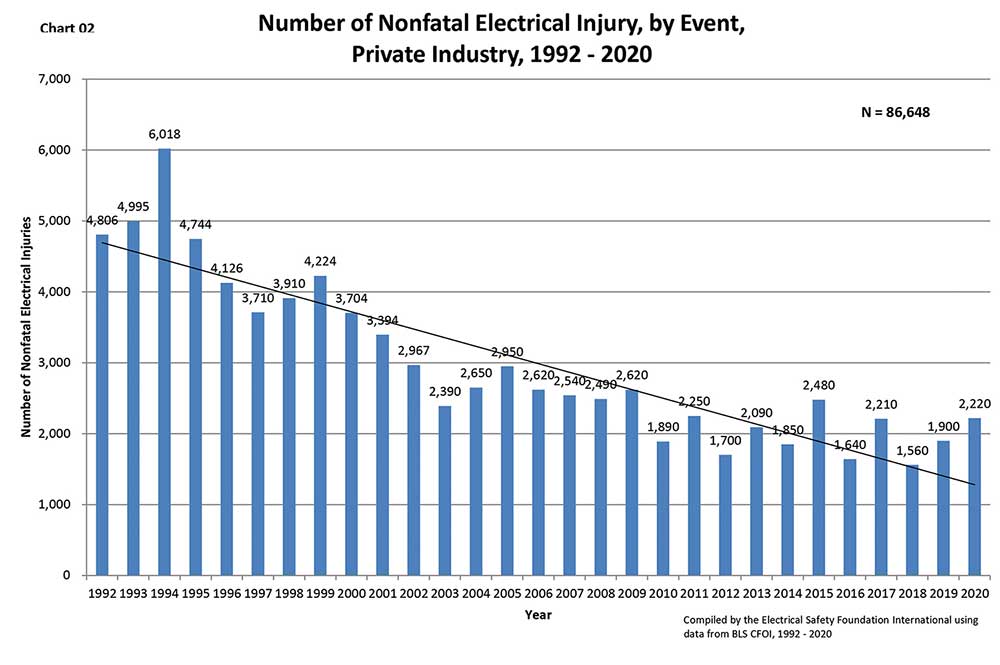
In 2020, there were 2,220 nonfatal electrical injuries involving days away from work, a 17% increase over 2019 and a return to 2017 levels. There were 126 electrical fatalities, a 24% decrease over 2019 and the lowest number of electrical fatalities since ESFI began compiling data in 2003. It is important to note there was a 10% drop in total hours worked in the United States in 2020, most likely due to the COVID-19 pandemic.
by Daniel Majano and Brianne Deerwester, Electrical Safety Foundation International
Nonfatal Electrical Injuries
A total of 1,176,340 workplace injuries, including electrical and non-electrical injuries, occurred in 2020. Of these cases, 33.2% or 390,020 cases were categorized as other diseases due to viruses not elsewhere classified, which includes reported COVID-19-pandemic related illnesses. The rate for all nonfatal injuries resulting in days away from work attributed to electricity during 2019 was 0.19%, while in 2020, 0.21% could be attributed to electricity.
The median number of days away from work for nonfatal electrical injuries was three in 2020, a 66% decrease from 2020. The median days away from work for direct exposure to electricity greater than 220 volts was seven days, followed by five days for indirect exposure to electricity 220 volts or less, and the median days for direct exposure to electricity 220 volts or less was three. Indirect exposure to electricity greater than 220 volts did not incur any injuries.
The number of nonfatal electrical injuries varied between age groups in the workforce. Workers aged 25 to 34 had the highest number of injuries with 24%, followed by workers aged 20 to 24 and 35 to 44 both with 22%, workers aged 45 to 54 made up 16% of the injuries, workers aged 55 to 64 made up 7%, workers 16 to 19 years old made up 2%, and finally workers 65 years and older made up 1%.
The length of service with an employer at the time of the injury also varied among workers. The highest percentage happened to workers who had been with their employer between one and five years at 32%, followed by more than five years at 31%, less than three months at 26%, and finally three months to 11 months at 10%. The weekday with the highest number of nonfatal electrical injuries included Tuesday with 33%, Thursday with 27%, Wednesday with 14%, Monday with 11%, Saturday with 8%, Friday with 4%, and finally Sunday with the lowest amount, 3%. The total shift length also affected when a nonfatal injury occurred. The hours with the highest percentage of accidents were between four to six hours with 32%, followed by two to four hours with 15%, six to eight hours with 10%, one to two hours at 9%, eight to 10 hours at 4%, less than one hour at 2%, and finally 10 to 12 hours at 1%. Twenty-seven percent of incidents did not report the hours worked.
The occupation with the highest percentage of workers involved in non-electrical injuries was “Installation, Maintenance, and Repair” with 31%, followed by “Service” with 25%, “Construction and Extraction” with 21%, “Production” with 11%, “Transportation and Material Moving” with 5%, and “Management, Business, Financial” with 2%. “Sales and Related,” “Healthcare Practitioners,” “Technical, Computer, Engineering and Science,” and “Office and Administrative Support” all had 1%. Sixty-five percent of fatalities occurred in service-providing industries, while 35% occurred in good-producing industries.
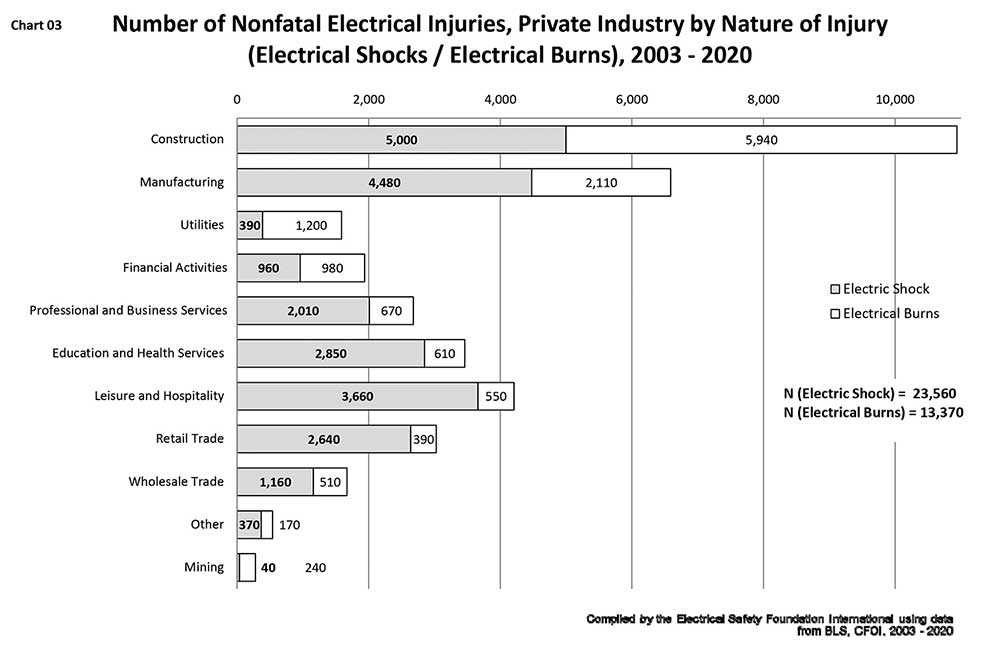
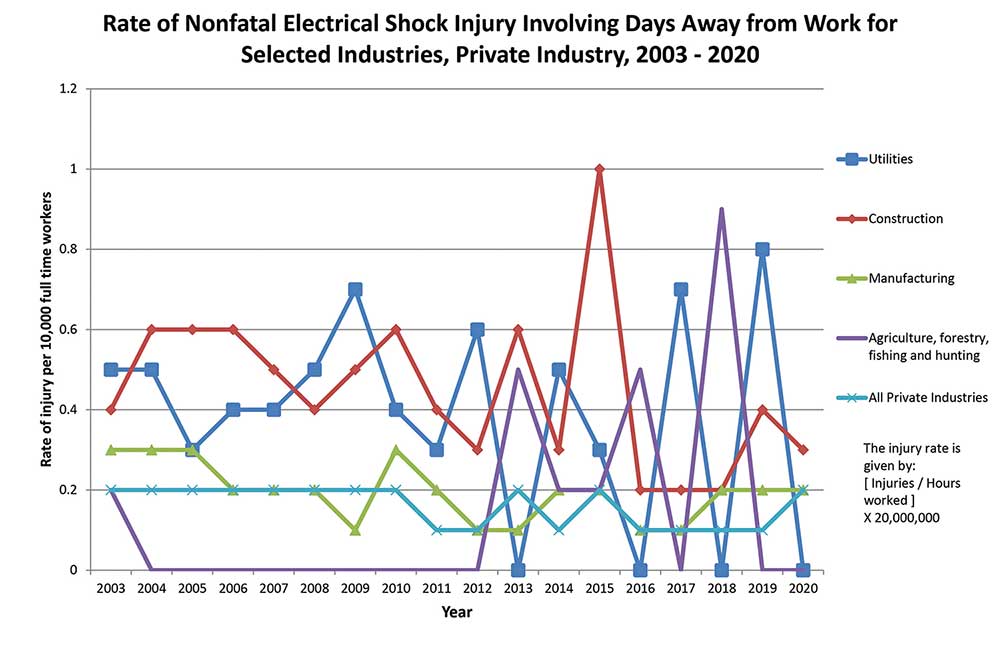
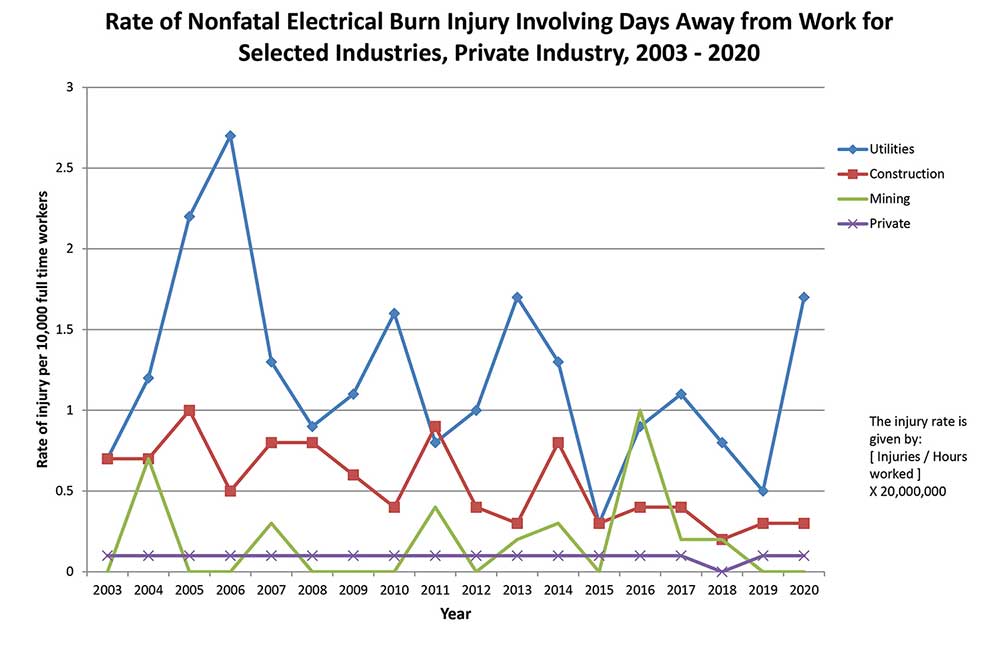
The industries with the leading number of nonfatal electrical injuries included “Accommodation and Food Services” with 22%, followed by “Construction” with 20%, “Wholesale Trade” with 17%, and “Manufacturing” with 14%. Electrical shocks accounted for 1,610 of the nonfatal electrical injuries, while burns accounted for 620.
Fatal Electrical Injuries
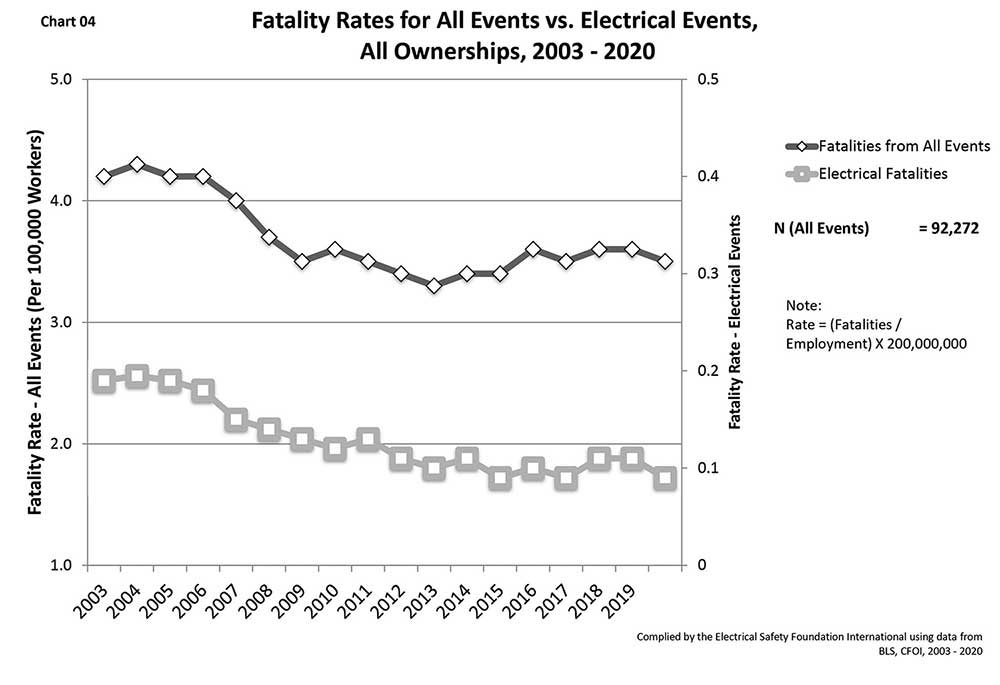
Contact with or exposure to electric current accounted for 2.6% of all workplace fatalities in 2020, a 19% drop from 2019 and a return to 2017 levels. Electrical fatality rates were 0.09 fatalities per 100,000 workers in 2020, which is a 22% drop from 2019, compared to a rate of 3.5 per 100,000 workers for all fatalities and all occupations. The mining industry had the highest rate of fatal electrical injuries in 2020, 0.8 fatalities per 100,000 workers, followed by the construction industry, 0.6 fatalities per 100,000 workers. The fatal injury rate for all industries was 0.1 fatalities per 100,000 workers. In 2020, 5.3% of all electrical incidents were fatal. “Constructing, Repairing, Cleaning” accounted for the leading worker activity for electrical fatalities at 64%. “Using or Operating Tools, Machinery” accounted for 22% of electrical fatalities.
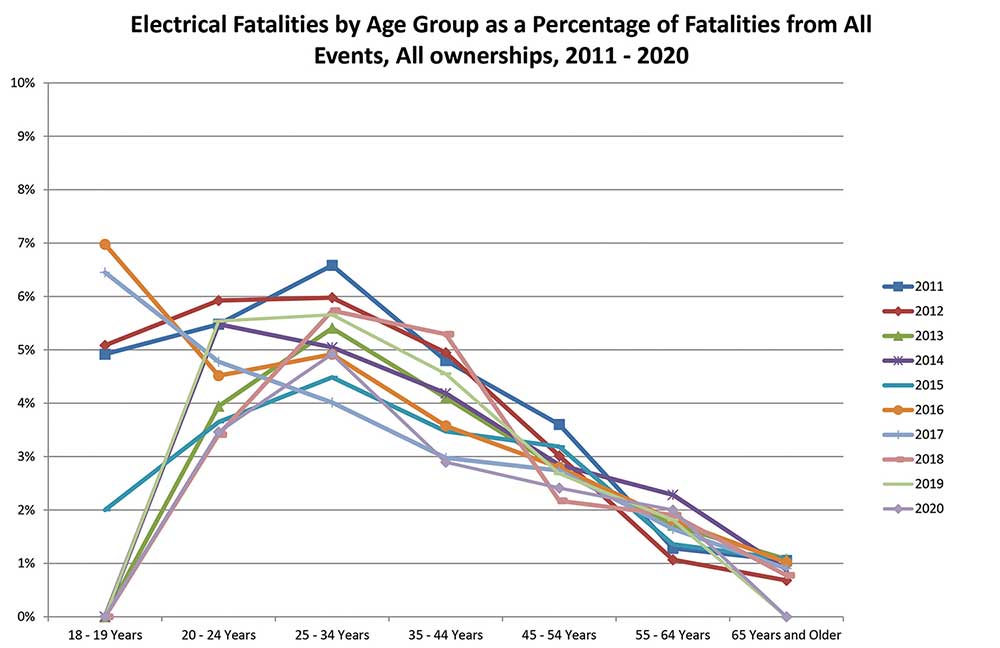
The number of electrical fatalities varied between age groups in the workforce. Workers aged 25 to 34 had the highest number of electrical fatalities with 33%, followed by workers aged 34 to 44 with 21%, workers aged 45 to 54 had 18%, workers aged 55 to 64 had 17%, and 7% of electrical fatalities occurred in workers aged 20 to 24. Hispanic or Latino workers accounted for 40% of electrical fatalities, a 24% increase over 2019. These workers also account for 18% of the workforce.
Thirty-three percent of all electrical fatalities occurred at a private residence. Industrial places and premises accounted for another 31% of fatalities. Streets and highways accounted for 13%, public buildings accounted for 8%, and farms for 7%. Private industry accounted for 154, or 94%, of the electrical fatalities.
The occupations involved in electrical fatalities included “Construction and Extraction Occupations” with 44% of the total fatalities, “Installation, Maintenance, and Repair Occupations” with 20%, “Building and Grounds Cleaning and Maintenance Occupations” with 13%, “Transportation and Material Moving Occupations” with 6%, “Management Occupations” with 5%, and “Farming, Fishing, and Forestry Occupations” with 3%.
Preventing Future Workplace Injuries
Despite a drop in overall workplace fatalities in 2020, there was a 17% increase in nonfatal workplace injuries. This data proves that more work needs to be done to prevent these tragic incidents. The majority of occupations getting injured are non-electrical with little or no electrical safety training. All workers should be provided electrical safety training whether they work directly with electricity or not. This training, coupled with safe work practices, will help decrease the 6.4 workplace injuries that occur daily. For free materials, you can share throughout your workplace to keep yourself and your employees or coworkers safe, visit esfi.org.