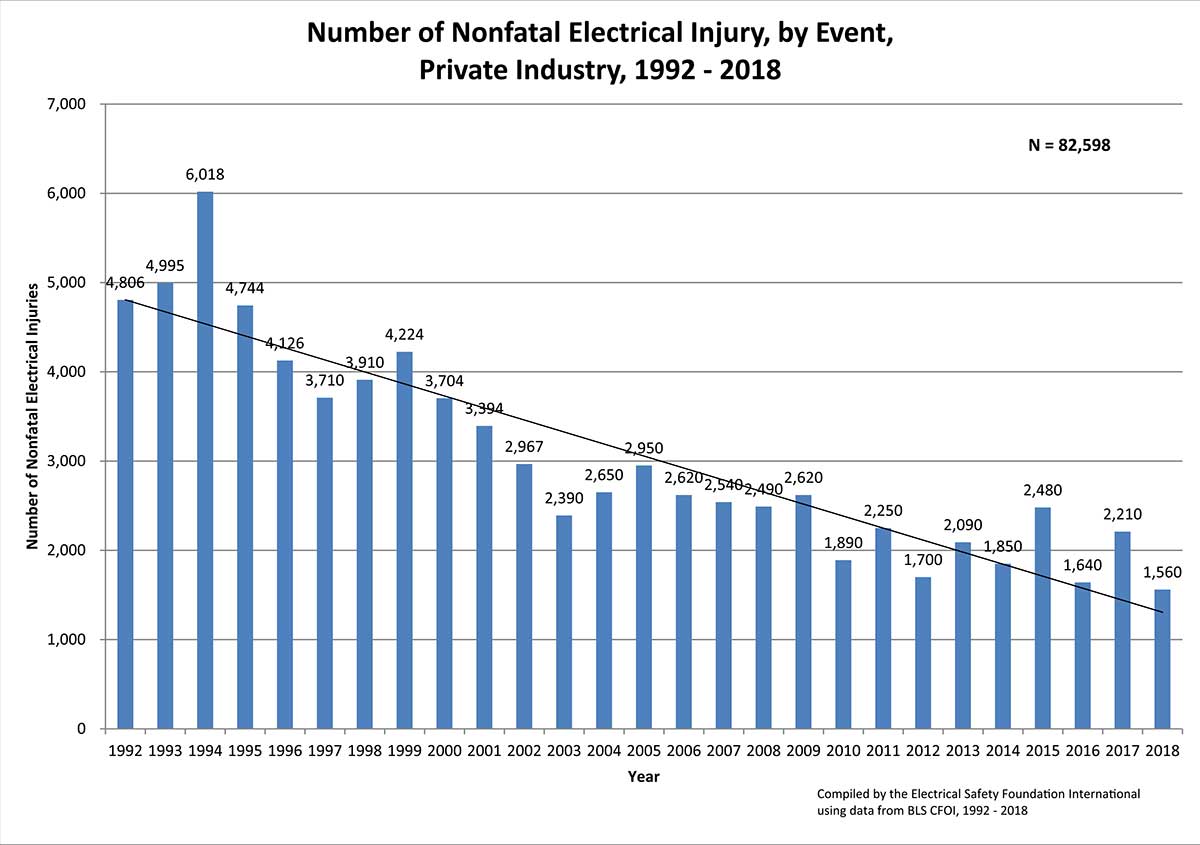
There was a record low number of nonfatal electrical injuries in 2018: 1,560, a 29% decrease over 2017. This was an 8% decrease over 2016, the year with the previous lowest number of nonfatal electrical injuries. OSHA’s top electrical violations of 2019 included failure to lockout/tagout and failure to wear personal protective equipment.
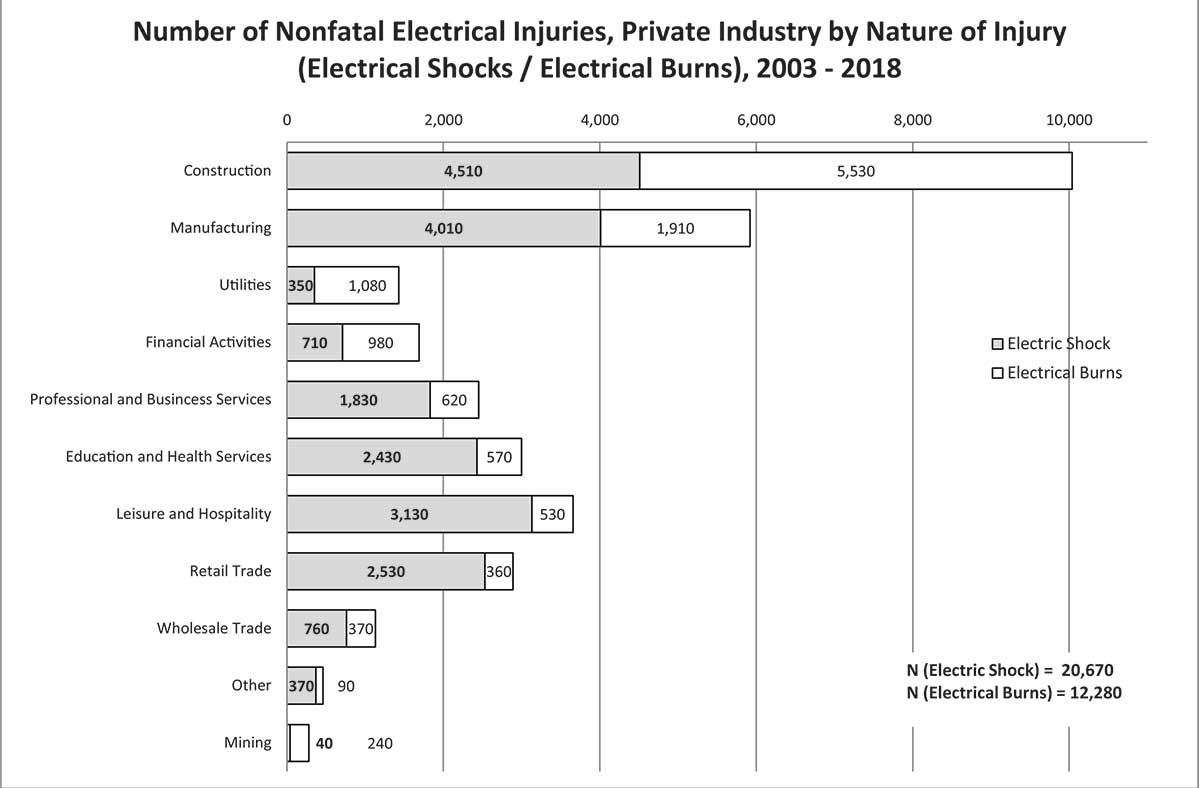
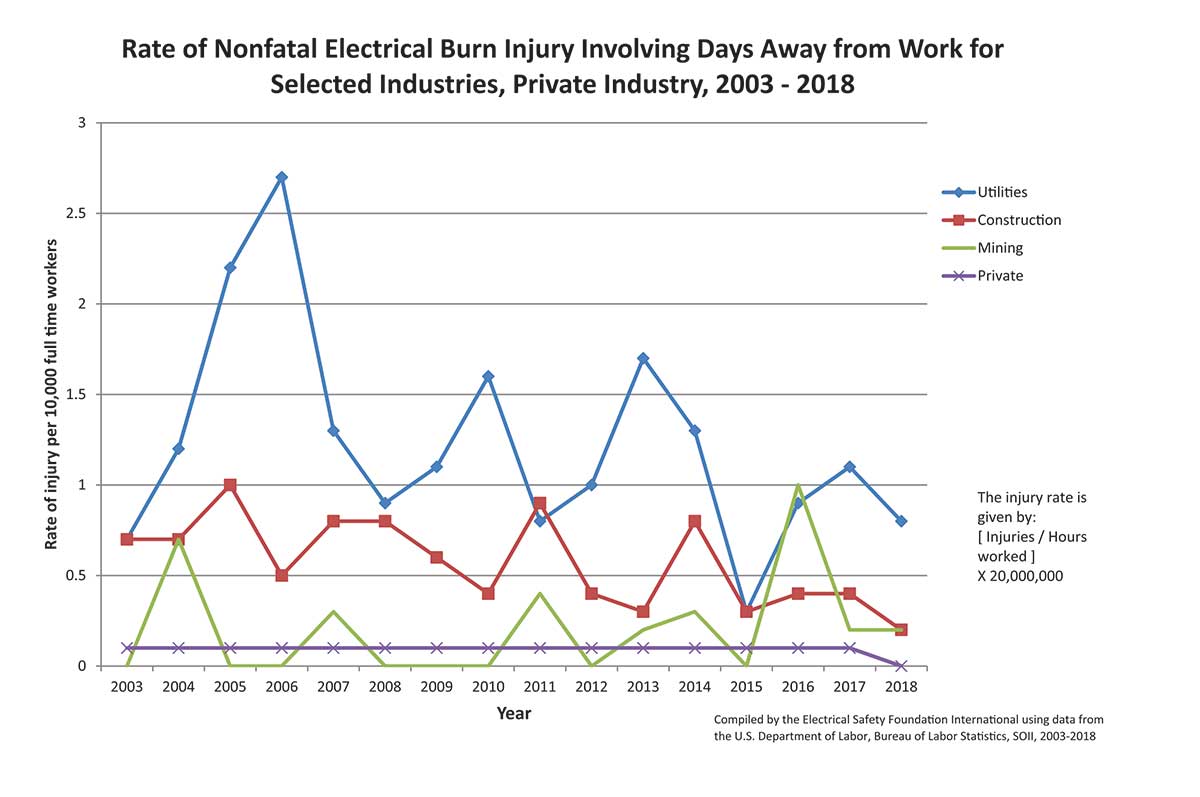
All electrically related fatalities were caused by electric shock; none were caused by burns. Electrical shocks accounted for 1,080 of the nonfatal electrical injuries, while burns accounted for 490.
Fatal Electrical Injuries
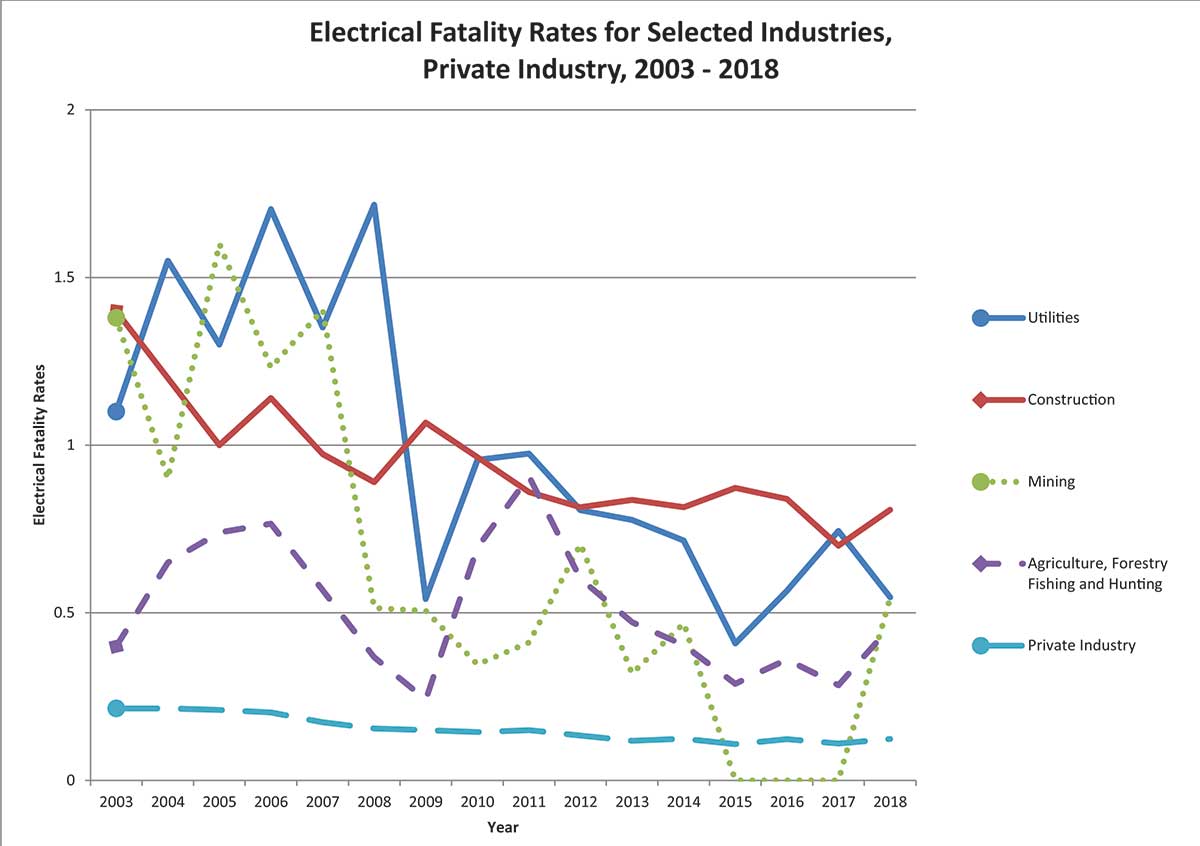
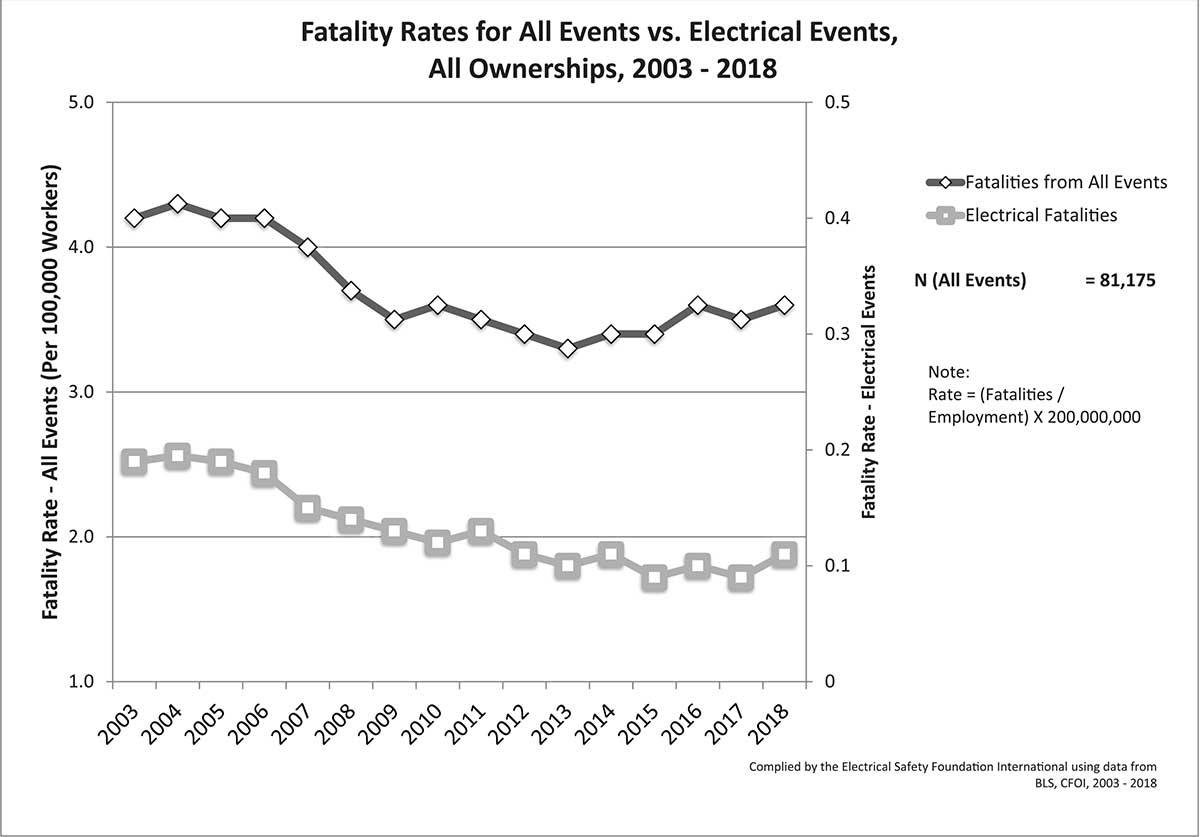
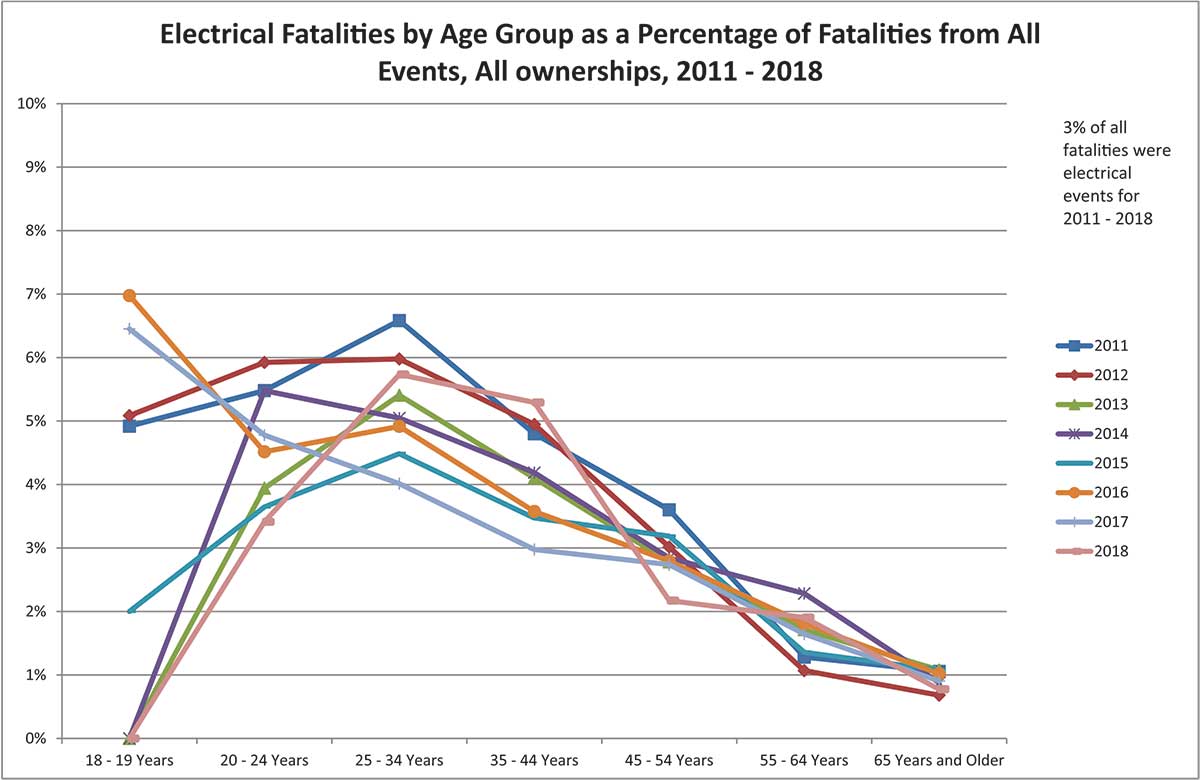
Contact with or exposure to electric current accounted for 3% of all fatalities in 2018.
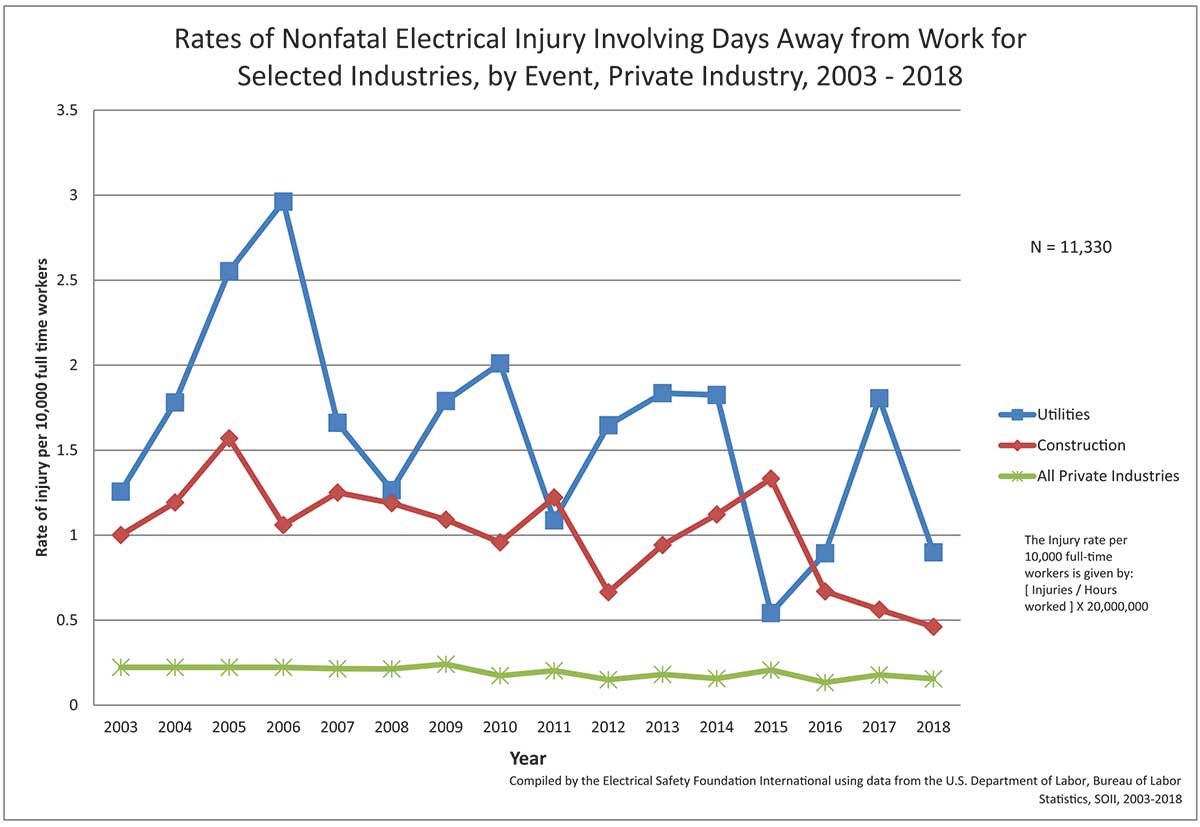
In 2017, that number was 2.6%, in 2016 2.9%, in 2015 2.7%, and 3.1% in 2014. The construction industry (0.8/100,000) had the highest rate of fatal electrical injuries, followed by utilities (0.55/100,000).
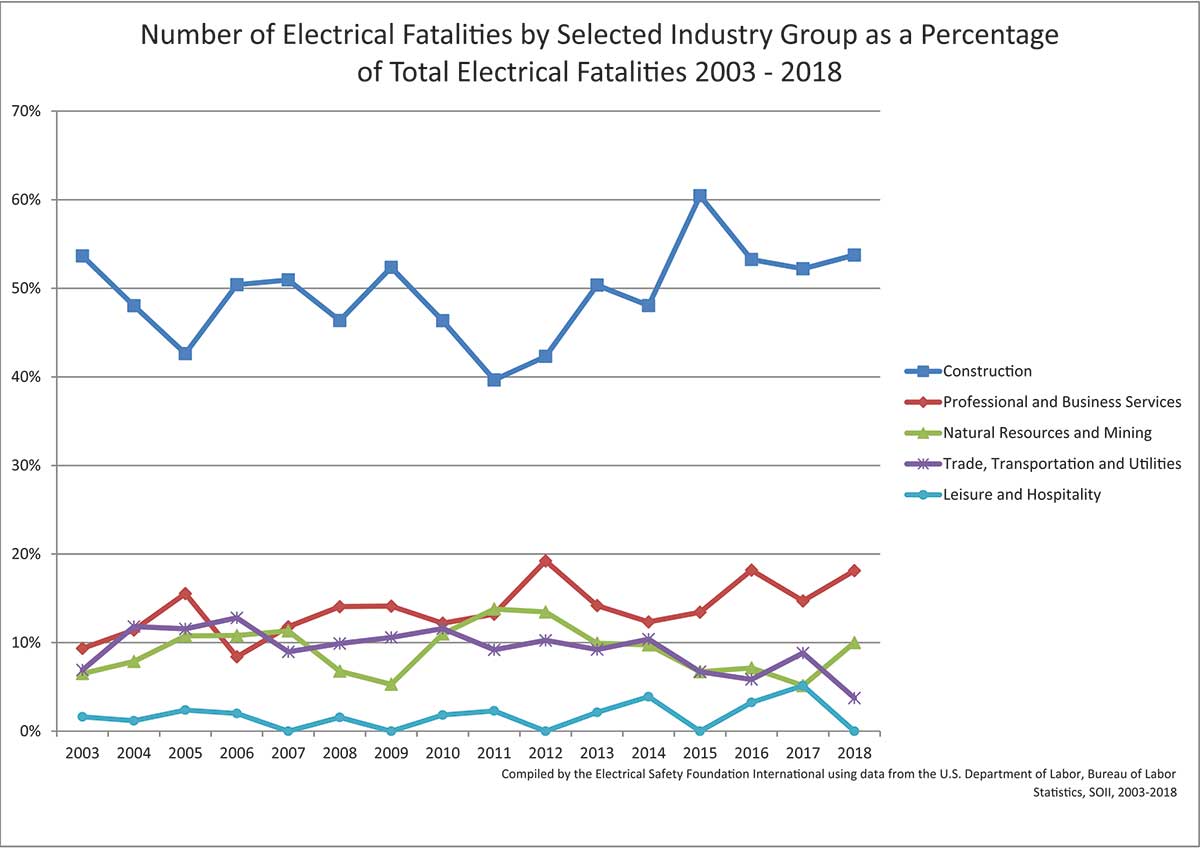
The construction industry accounted for 54% of all electrical fatalities, the same percentage as in 2017. Professional and business services accounted for 28% of electrical fatalities. Good producing private industries, which includes natural resources and mining, construction, and manufacturing, accounted for 71% of fatal electrical injuries. Service-providing private industries accounted for 28%.
The leading primary source of fatal electrical injury included parts and materials: 41%, machine tool, and electric parts: 36%, tool, instruments and equipment: 17%, machinery: 14%, and vehicles: 14%.
The number of electrical fatalities varied greatly between age groups. Workers aged 25 – 34 had the highest percent of electrical fatalities: 31%. Workers aged 34-44 followed closely at 30%. The workers aged 65+ had the lowest percentage of fatalities: 4%. The youngest group of workers in the data set, ages 20-24, had 6% of electrical fatalities. Workers aged 45-54 and 55-64 had the same percentage of electrical fatalities: 14%.
Constructing, repairing, and cleaning accounted for the leading worker activity for electrical fatalities at 63%. Using or operating tools and machinery accounted for 23% of electrical fatalities.

The construction and extraction occupations accounted for 47% of electrical fatalities. Installation, maintenance, and repair occupations accounted for 21% and building and grounds cleaning and maintenance occupations: 15%.
The majority of electrical fatalities occurred in private residences: 35%. A total of 26% occurred in industrial place and premises, while 13% happened in street and highway.
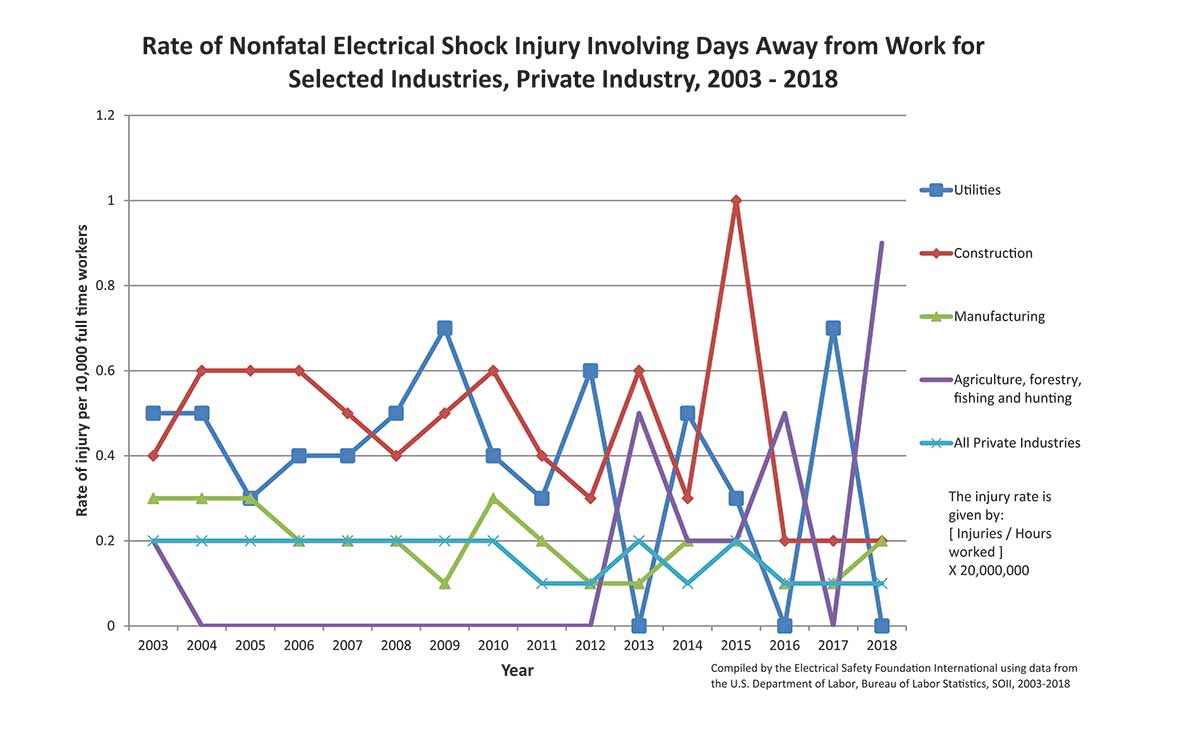
Nonfatal Electrical Injuries
The construction, 20%, and manufacturing, 16%, industries lead the number of nonfatal electrical injuries, followed by leisure and hospitality, 13%, education and health services, 11%, and accommodation and food services, 10%. The total amount of electrical injuries in the construction industry was 310.
In 2018, 0.17% of all nonfatal injuries resulting in days away from work could be attributed to electricity. In 2017, 0.25% could be attributed to electricity. The median number of days away from work for nonfatal electrical injuries was four in 2018, a 60% drop from 2017, returning to 2014 levels.
Preventing Future Workplace Injuries and Fatalities
While year-over-year fatal injuries increased, only 3% were caused by contact with or exposure to electricity. Since nonfatal injuries were at a record low, the median number of days away from work due to the electrical injury was reduced to four. Previously in 2003-2017, that number was 10.
ESFI is currently reviewing OSHA reports to provide a definitive narrative of what occupations and actions are causing the electrical fatalities. By studying the occupations with the most electrical injuries and fatalities, ESFI is able to focus its efforts on creating materials targeted to those industries. In 2018, ESFI found that 60% of electrical fatalities occurred in non-electrical fields and 40% of fatalities were caused by overhead power lines. This data prompted ESFI to create a series of overhead power line safety materials including: “Overhead Power Line Contact” infographics and videos in both English and Spanish, “Always Look Up – Trades” videos in English and Spanish, and a “Limits of Approach – Always Look Up” infographic in English. These materials were targeted to industries that had little or no electrical safety training.
ESFI’s online electrical training and hazard awareness materials, which are available for download at ESFI.org, are aimed at safety education for both the general public and workers. These workplace safety materials provide valuable information and tips for creating a safer work environment, whether the work takes place in an office, on a job site, or in a manufacturing setting. ESFI is continually focused and dedicated to reducing the number of electrically related injuries and fatalities in the workplace.