Contact with electricity is one of the leading causes of fatalities in the workplace. Each year, ESFI provides statistical data on occupational electrical injuries and fatalities to help decision makers better allocate safety resources to workers. The most recent data covers 2011-2023 data from the U.S. Bureau of Labor Statistics and the Occupational Safety and Health Administration. It was compiled in January of 2025.
BACKGROUND
ESFI’s occupational electrical injury and fatality information has been compiled from data published by the U.S. Bureau of Labor Statistics (BLS) and the Occupational Safety and Health Administration (OSHA)
Each year the BLS performs its Census of Fatal Occupational Injuries (CFOI). This is an actual count, or census, of fatal injuries. Each case is verified by two or more independent sources of information. Such sources can include death certificates, police reports, news reports, OSHA reports, etc. Similarly, to estimate the number of nonfatal injuries and illnesses, the BLS performs its Survey of Occupational Injuries and Illnesses. Nonfatal injuries, due to their sheer number, are statistically estimated based on a large annual survey of injuries reported by employers. Click here for more information on the scope of the CFOI.
OSHA 170 reports provide additional context regarding the incidents including occupation, cause, and a narrative of what led to the electrical incident. OSHA 170 forms are made available to the public once the report has been completed and personal information is removed from the report. This may result in slightly different totals between the two data sources.
Electrical Safety in the Workplace
- Contact with electricity is one the leading causes of fatalities in the workplace
- 74% of workplace electrical fatalities occurred in non-electrical occupations according to OSHA
- 150 workplace electrical fatalities occur on average every year according to the BLS
- 3% of all workplace fatalities were caused by contact with electricity
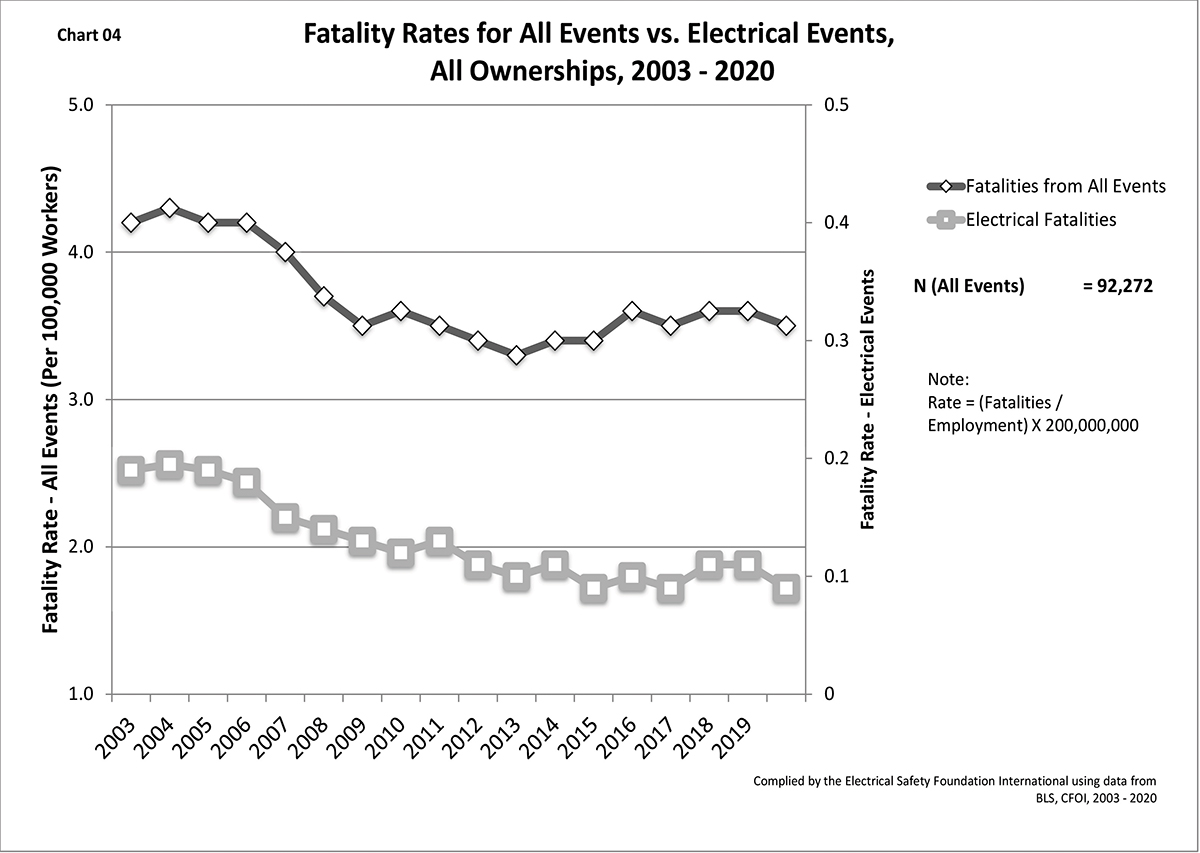
Electrical Fatality Rates
- Electrical fatality rates have remained consistent year over year. More needs to be done to reduce the amount of electrical fatalities in the workplace
- Hispanic or Latino workers have the highest rate of electrical fatalities and experience a disproportional amount of electrical fatalities
- Construction and extraction occupations; installation, maintenance, and repair occupations; and building and grounds cleaning and maintenance occupations have the highest rate of electrical fatalities
Electrical Fatality by Occupation
10 occupations accounted for over 58% of all workplace electrical fatalities:
- Electricians
- Laborers, except construction
- Construction laborers
- Electrical power installers & repairers
- Tree trimming occupations
- Electricians’ apprentices
- Heating, air conditioning, & refrigeration mechanics
- Roofers
- Heavy truck drivers
- Painters in construction or maintenance
Electrical Fatality Causes
91% of all workplace electrical fatalities were caused by:
- Overhead power line contact: 42.8%
- Unexpected contact with electricity: 19.3%
- Nearby energized equipment contact: 12.7%
- Working on energized parts: 4.1%
- Ground-faults: 4.0%
- Damaged wiring or equipment: 3.1%
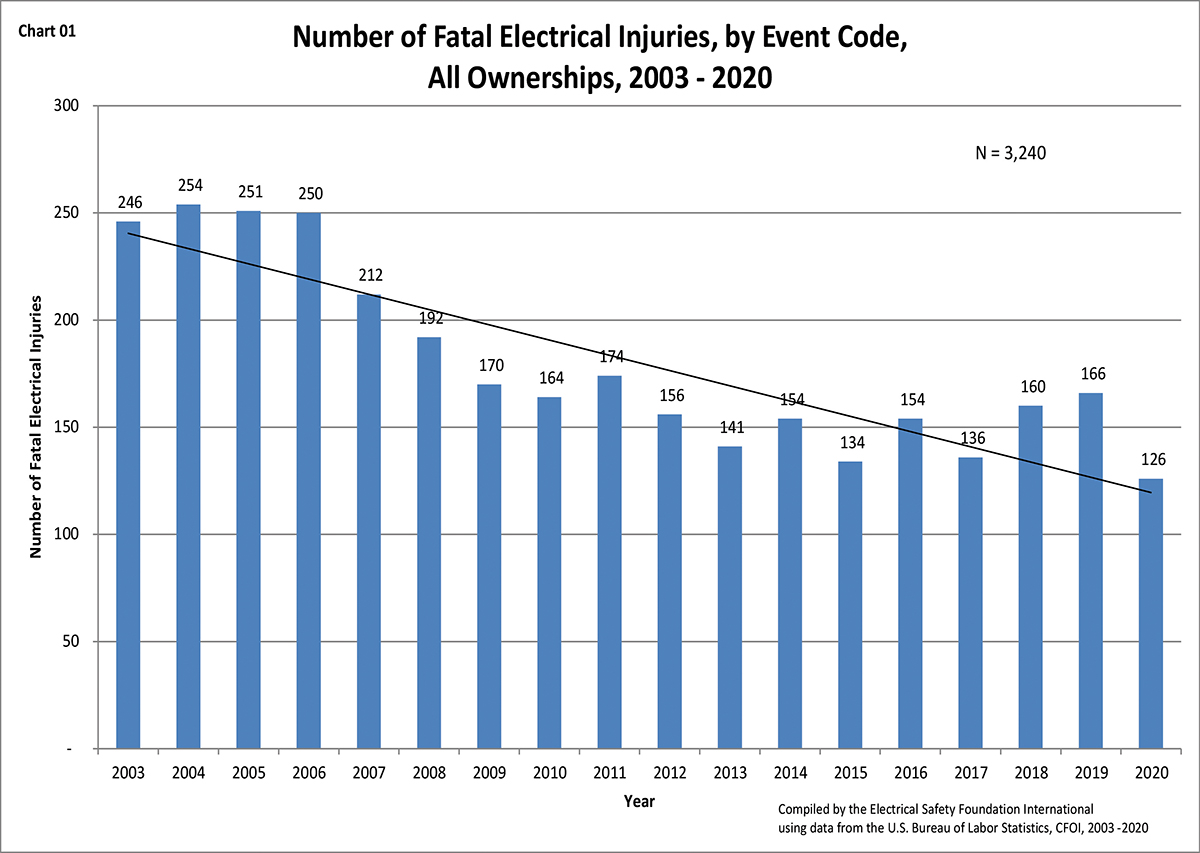
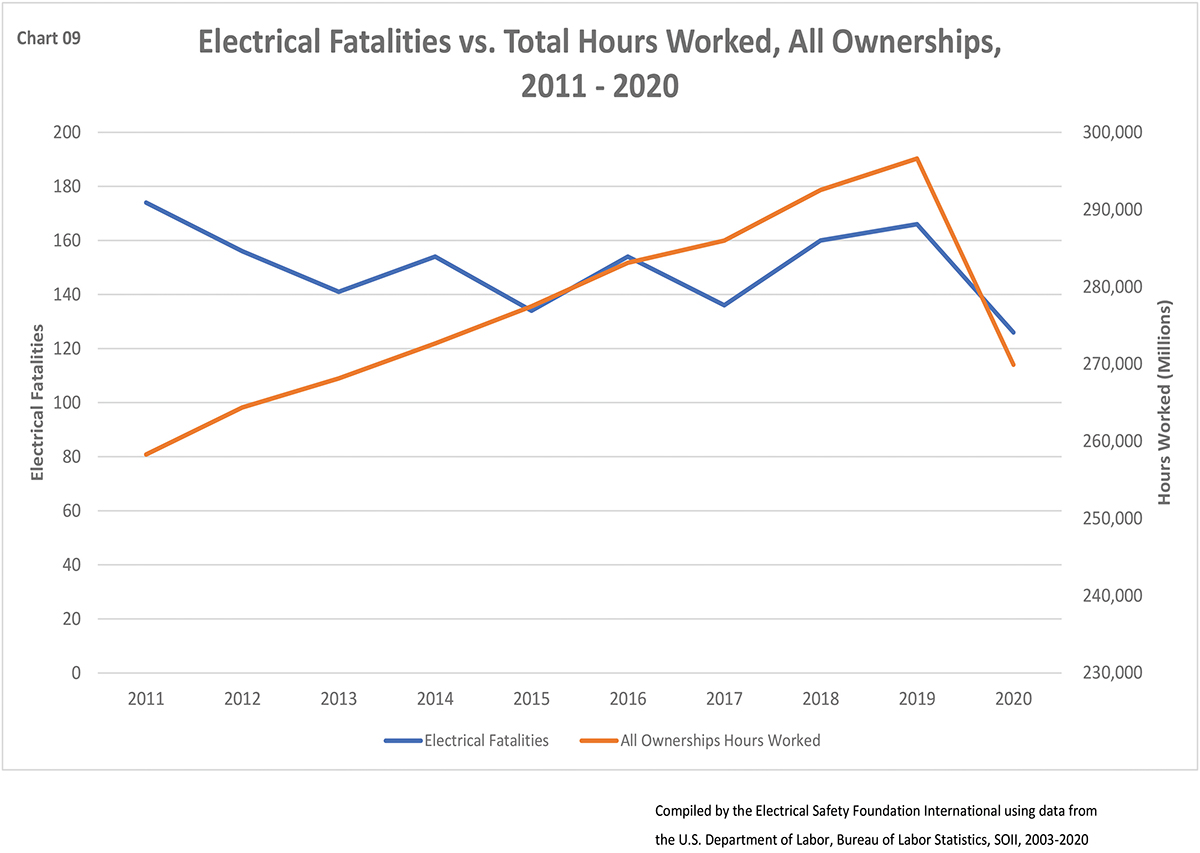
Fatal Electrical Injuries Figures (2011-2023)
Electrical fatalities continue to stay consistent year over year
While there was a slight increase from 2022 to 2023, the number of electrical fatalities per year has been trending slightly downward since 2011
Electrical Fatalities account for 5.6% of all workplace fatalities
Non-electrical occupations account for 74% of workplace electrical fatalities
Leading Fatality Causes:
- Working on or near live wires: 51%
- Overhead power line contact: 48
Occupations with 10 or more electrical fatalities (as reported by OSHA 170 Form; totals may not equal BLS reported fatalities):
- Electricians: 212
- Laborers, Except Construction: 142
- Construction Laborers: 131
- Electrical Power Installers and Repairers: 122
- Tree trimming occupations: 64
- Electricians’ apprentices: 45
- HVAC and Refrigeration Mechanics: 43
- Roofers: 38
- Truck drivers; Heavy: 35
- Painters, Construction and Maintenance: 32
- Machinery Maintenance Occupations: 28
- Telecomm: Line Installers & Repairers: 27
- Installers and repairers: 23
- Electrical and Electronic Engineers: 22
- Carpenters: 20
- Electrical and Electronic Technicians: 17
- Welders and Cutters: 16
- Chainsaw Operators: 14
- Helpers, Construction Trades: 14
- Supervisors; Electronics & Power Transmission Installers: 13
- Technicians, Not Elsewhere Classified: 13
- Farm Workers: 13
- Groundkeepers & Gardeners (except Farm Workers): 13
- Construction Trade, Not Elsewhere Classified: 11
- Plumbers, Pipefitters, and Steamfitter Apprentices: 10
Electrical Occupation Fatalities (444)
- Electrical Occupation Fatalities
- Electricians: 212
- Electrical power installers and repairers: 122
- Electricians’ apprentices : 45
- Electrical and electronic engineers: 22
- Electrical and electronic technicians: 17
- Supervisors; electricians & power transm. install.: 13
- Electrical and electronic equipment assemblers: 6
- Electronic repairers, communica. & indus. equip.: 7
Electrical Occupations involved with 10 or more Overhead Power line Contact (110 fatalities)
- Electrical power installers and repairers: 68
- Electricians: 14
Non-Electrical Occupations (1,023 Fatalities)
Non-Electrical Occupations with 10 or more Electrical Fatalities
- Laborers, Except Construction: 142
- Construction Laborers: 131
- Tree Trimming Occupations: 64
- HVAC and Refrigeration Mechanics: 43
- Roofers: 38
- Truck Drivers; Heavy: 35
- Painters, Construction and Maintenance: 32
- Machinery Maintenance Occupations: 28
- Telecomm: Line Installers & Repairers: 27
- Installers and Repairers: 23
- Carpenters: 20
- Welders and Cutters: 16
- Chainsaw Operators: 14
- Helpers, Construction Trades: 14
- Groundskeepers and Gardeners, Except Farm: 13
- Farm Workers: 13
- Technicians, Not Elsewhere Classified: 13
- Construction Trade, Not Elsewhere Classified: 11
- Plumber, Pipefitter, and Steamfitter Apprentices: 10
Non-Electrical occupations with 10 or more OHPL fatalities (587)
- Laborers, except construction: 86
- Construction laborers: 86
- Tree trimming occupations: 59
- Roofers: 31
- Truck drivers; heavy: 29
- Painters, construction and maintenance: 28
- Telecomm: Line installers and repairers: 24
- Chainsaw Operators: 14
- Carpenters: 12
- Groundskeepers and Gardeners, Except Farm: 10
Fatality Cause: Working on or near live wires (750 Fatalities)
- Occupations with 10 or more fatalities caused by working on or near live wires
- Electricians: 189 (25%)
- Occupation not reported: 65 (9%)
- Electrical power installers and repairers: 46 (6%)
- Construction laborers: 42 (6%)
- Electricians’ apprentices: 39 (5%)
- Heating, air conditioning, and refrig. Mechanics: 38 (5%)
- Machinery maintenance occupations: 24 (3%)
- Electrical and electronic engineers: 18 (2%)
- Electrical and electronic technicians: 17 (2%)
- Welders and cutters: 16 (2%)
- Installers and Repairers: 14 (2%)
- Supervisors; electricians & power transm. installers: 10 (1%)
Fatality Cause: Overhead Power Lines (629 Fatalities)
Occupations with 10 or more fatalities caused by working on or near live wires (692)
- Tree trimming occupations: 86 (14%)
- Electrical power installers and repairers: 77 (12%)
- Laborers, except construction: 75 (12%)
- Construction laborers: 75 (12%)
- Occupation not reported: 59 (9%)
- Truck drivers, heavy: 26 (4%)
- Roofers: 25 (4%)
- Painters, construction and maintenance: 25 (4%)
- Telecomm: Line Installers And Repairers: 21 (3%)
- Electricians: 18 (3%)
- Carpenters: 12 (2%)
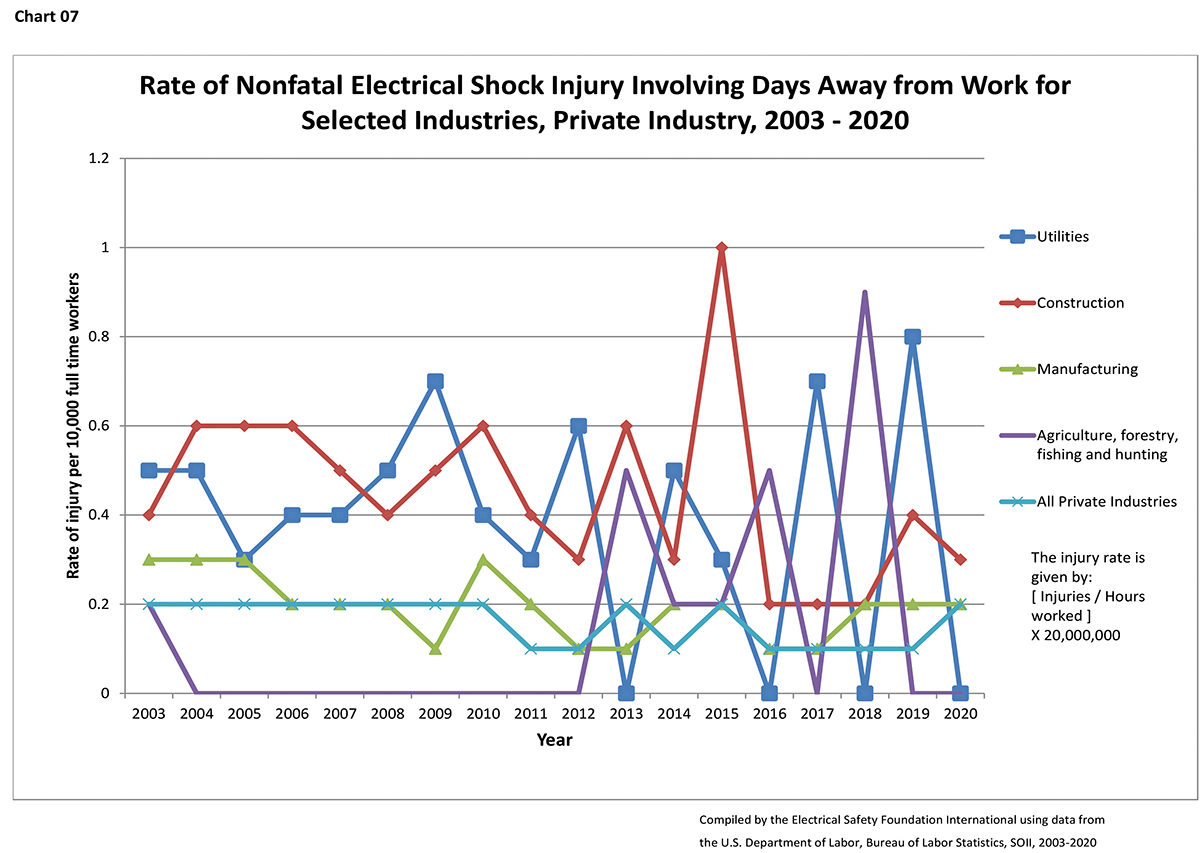
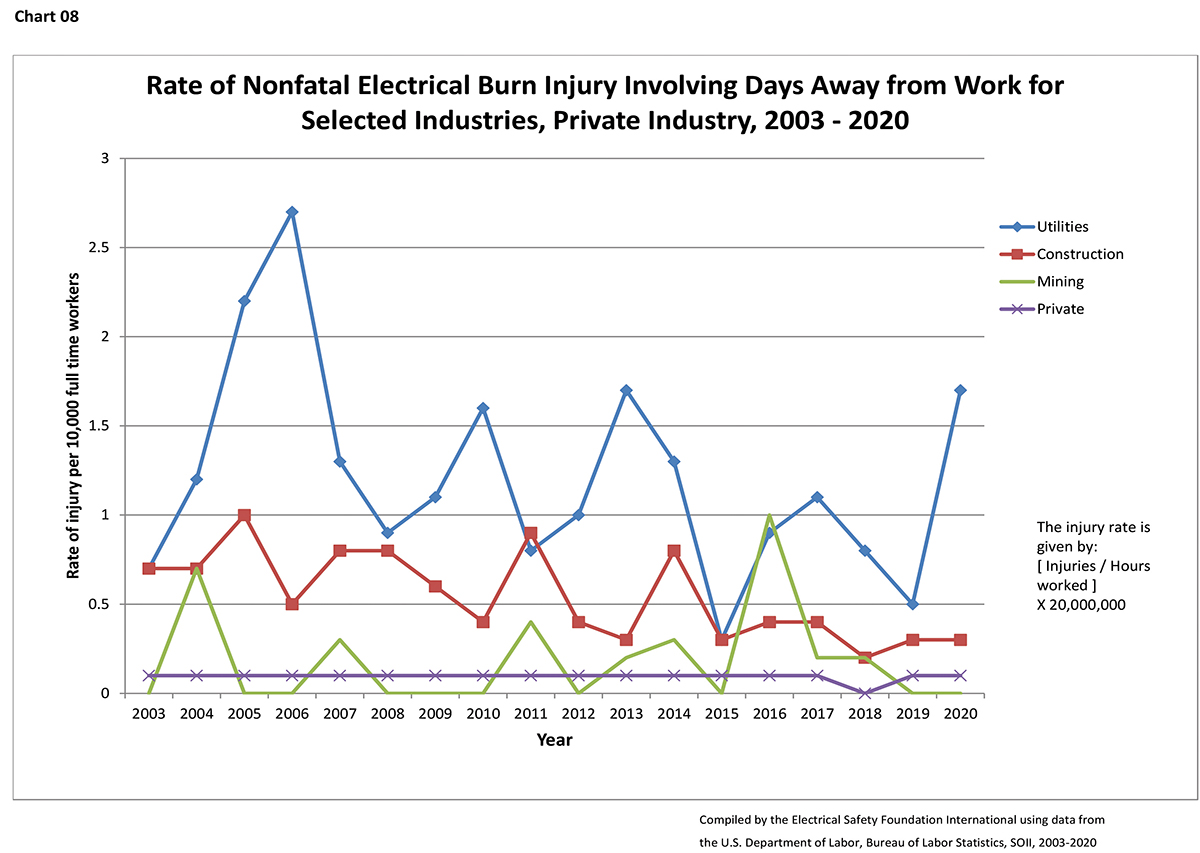
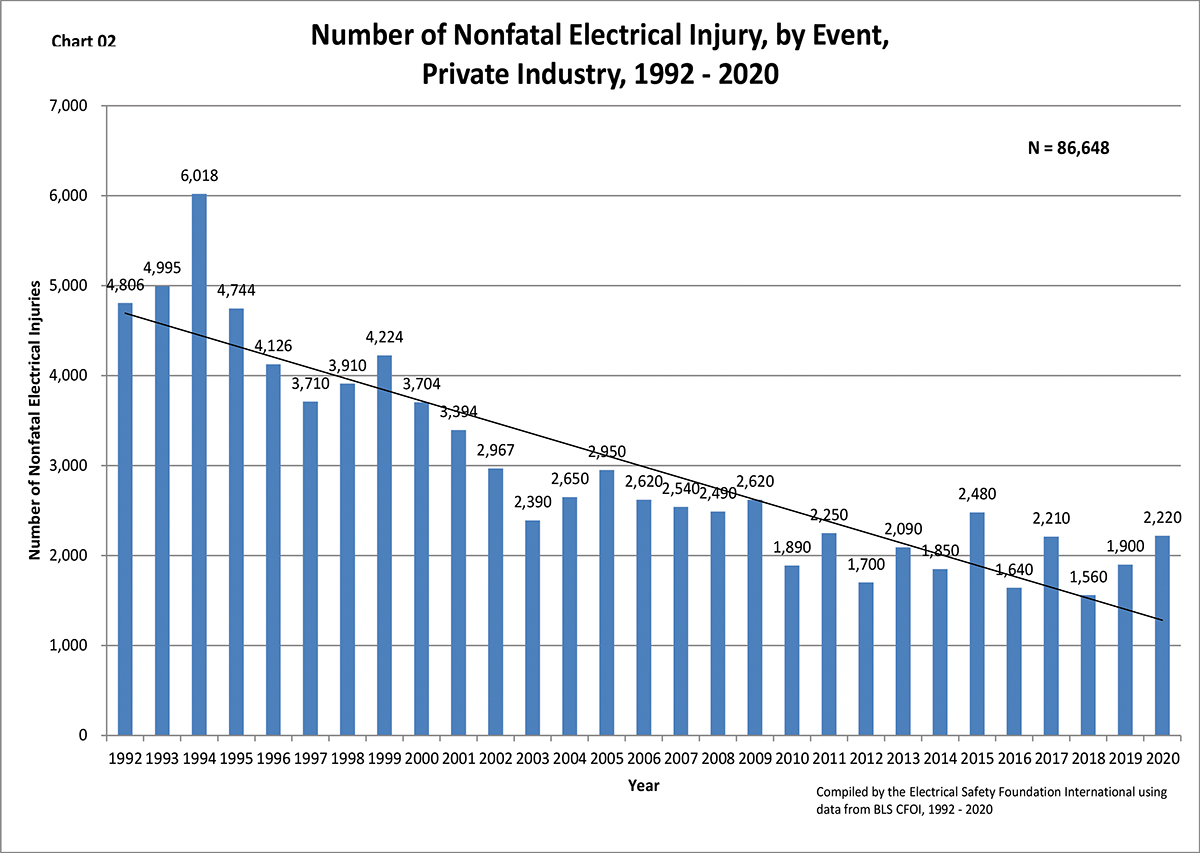
Nonfatal Electrical Injuries Figures (2011-2023)
There were 3,260 non-fatal electrical injuries involving days away from work in 2021 and 2022 (combined). This was a 21% decrease from the previous two years.
0.11% of all nonfatal injuries resulting in days away from work could be attributed to electricity in 2021 and 2022.
Age of worker involved in non-fatal electrical injury:
16 – 19 years old: 4%
20 – 24 years old: 22%
25 – 34 years old: 24%
35 – 44 years old: 22%
45 – 54 years old: 16%
55 – 64 years old: 7%
65 years and over: 1%
15% of electrical injuries occurred in Hispanic or Latino workers.
Occupation of worker involved in non-electrical injury:
- Installation, Maintenance, and Repair: 28%
- Construction and Extraction: 25%
- Service: 13%
- Production: 9%
- Transportation and Material Moving: 7%
- Office and Administrative Support: 5%
- Management, Business, Financial: 4%
- Sales and Related: 3%
- Farming, Fishing, and Forestry: 2%
- Computer, Engineering and Science: 2%
- Healthcare Practitioners and Technical: 2%
- Educational Instruction and Library Occupations: 1%
Length of service with employer when injury occurred:
- Less than 3 Months: 10%
- 3 Months to 11 Months: 21%
- 1 year to 5 Years: 36%
- More Than 5 Years: 32%
Days when non-fatal electrical injury occurred:
- Sunday: 3%
- Monday: 22%
- Tuesday: 17%
- Wednesday: 17%
- Thursday: 21%
- Friday: 16%
- Saturday: 5%
Hours worked when non-fatal injury occurred:
- Less than 1 hour: 7%
- 1 – 2 Hours: 7%
- 2 – 4 Hours: 20%
- 4 – 6 Hours: 21%
- 6 – 8 Hours: 17%
- 8 – 10 Hours: 10%
- 10 – 12 Hours: 2%
- Not Reported: 15%
The median number of days away from work for nonfatal electrical injuries was 5 in 2021 and 2022.
Summary
The Electrical Safety Foundation has compiled occupational electrical injury and fatality data from the U.S. Bureau of Labor Statistics for the period 2011 through 2023. A total of 70,692 occupational fatalities occurred from all causes. 1,940 of these were due to contact with electricity.
98.9% of the electrical fatalities in this period were men. The percentage of fatalities that involved self-employed workers was similar in both the overall and electrically related workplace fatality data (20% and 21%, respectively). 64% of overall workplace fatalities involved white workers, 19% involved Hispanic or Latino workers, and 11% involved Black workers. For electrically related fatalities, these figures were 63%, 28%, and 6%.
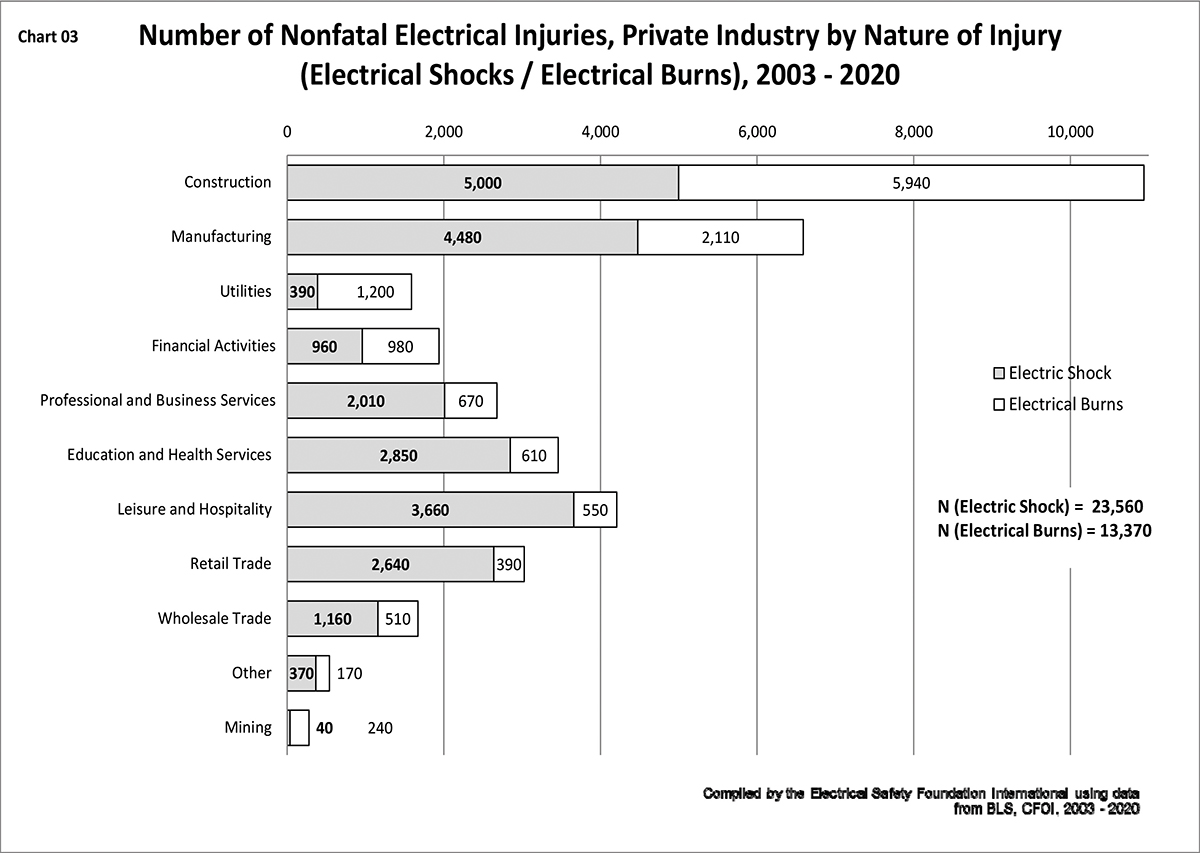
The construction industry had the highest number of electrical fatalities (855), followed by professional and business services (212), trade, transportation, and utilities (155), natural resources and mining (138), and manufacturing (120). Just five occupations in the construction trades – electricians, construction laborers, roofers, painters, and carpenters – experienced 30% of all electrical fatalities.
Among the workers who were fatally injured by electricity, 33% died at a private residence, 28% on industrial premises, and 11% on a street or highway. 96% were employed in private industry.