The most significant change to the 2002 National Electrical Safety Code (NESC) is in the strength and loading requirements for aerial electric distribution and transmission facilities. Supporting structures and their supported facilities shall be designed to withstand extreme wind loading and a combination of ice and wind loading.

Photo 1. An example of a line failure due to a combination of extreme wind and ice
Loading Districts
Figure 250-1, on page 162 of the NESC, is a map of the USA divided into three ice, wind, and temperature loading districts identified as HEAVY, MEDIUM, and LIGHT. Table 250-1 on page 162 specifies the radial thickness of ice, horizontal wind pressure and temperature conditions by loading district for which supporting structures and supported facilities must be designed. For example, the state of Pennsylvania is in the HEAVY loading district where aerial facilities must be designed to withstand a 0.5 inch radial thickness of ice in combination with a 40-mile-per-hour wind, which exerts a four pounds-per-square-foot force on the structure at 0°F. In contrast, the state of Florida is in the LIGHT loading district where aerial facilities must be designed to withstand a 60-miles-per-hour wind, which exerts a force of nine-pounds-per-square-foot pressure on the structure at 30°F (no ice).
Extreme Wind Loading
In Rules 261A1c and 261A2f, supporting structures, equal to or shorter than 60 feet in height above ground or water, shall be designed to withstand the extreme wind load applied only to the structure. The extreme wind load is not applied to the supported facilities. In Rule 250C, all structures taller than 60 feet in height shall be designed to withstand the extreme wind load applied to the entire structure and supported facilities.
1997 NESC
In the 1997 NESC, the wind pressure as a result of the extreme wind was calculated in Rule 250C as follows:
wind pressure in pounds = 0.00256 x V2 x shape factor x projected area
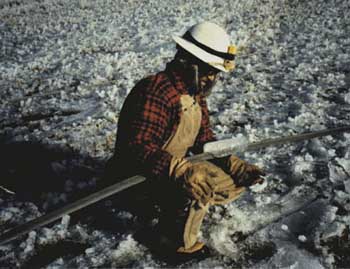
Photo 2. An example of ice loading on a conductor
V was the basic wind speed at 33 feet above ground from the map of the USA in Figure 250-2. The wind speeds in Figure 250-2 ranged from 70 to 110 miles-per-hour depending upon the location. When calculating wind loading on parts of the structure located higher off the ground than 33 feet, the wind speeds had to be increased appropriately.
Shape factor was 1.0 for cylindrical elements like wire and round utility poles. The shape factor was 1.7 for flat surfaces. Shape factors for lattice structures were covered in Rule 252B2c.
The projected area was the cross-sectional area of the element of the supporting structure or supported facility for which the loading was being calculated.
2002 NESC
In the 2002 NESC, the wind pressure as a result of extreme wind is calculated as follows:
wind pressure in pounds = 0.00256 x V2 x kz x GRF x I x Cd x projected area
V is now three-second-gust wind speed from Figure 250-2 (four pages of maps). The wind speeds range from 90 to 170 miles-per-hour depending upon the location.
Kz is the velocity pressure exposure coefficient defined in Rule 250C1 and Table 250-2. For structures, kz varies from 0.92 to 1.40 depending upon structure overall height. For wire, kz varies from 1.0 to 1.50 depending upon the height of the wire above ground.
GRF is the gust response factor from Table 250-3. For structures, GRF varies from 1.02 to 0.83 depending upon overall structure height. For wire, GRF varies from 0.63 to 0.93 depending upon span length and wire height above ground.
I is importance factor. I is 1.0 for utility structures.
Cd is the same shape factor as discussed earlier.
The projected area is the same as discussed earlier.
The significant difference between the 1997 and the 2002 codes is the difference in wind speeds. Since wind pressure is a function of the square of the wind speed, a small increase in wind speed results in a large increase in wind pressure. In some areas of the country, the wind speed has increased significantly. For example, in the coastal beach area of Delaware, we used to design our facilities for 90 mph wind. Under the new code, we now design our facilities for 115 mph wind. This 28 percent increase in wind speed results in a 63 percent increase in wind pressure. Some utilities estimate that this NESC change will result in a 50 percent increase in transmission line construction costs with very little increase in safety.
In areas where transmission lines were not falling down due to extreme winds prior to 2002, increasing the strength will not improve safety.
National Electrical Safety Code and NESC are registered trademarks of the Institute of Electrical and Electronic Engineers (IEEE).