Heat is one of the enemies of electrical systems. As part of a larger study of elevated ambient temperatures in residential and non-residential structures in Las Vegas, Nevada, two experiments were carried out that would seem to require some action in the National Electrical Code. They involve 1) bundled cable normally found above a load center or at other points of concentrated electrical service, and 2) conductors in conduits exposed to direct sunlight.
The bundling experiment involved electrical loads in two each of 14 AWG, 12 and 10 Type NM-B cables, two conductors with ground, a total of 12 loaded conductors. The cables were routed through a 1-1/2 inch vertical hole in a wood top plate that was then fire-stopped. The cables were all loaded in increments up to 80 percent of their design loads (up to 12, 16 and 24 amps, respectively). In combination with high outdoor temperatures, the cables reached temperatures as high as 233°F (112°C) at the limit of 80 percent continuous loading, well above the design limit of 194°F (90°C) for these cables, constituting a clearly dangerous environment.
The solar rise experiment showed that unloaded cables contained inside conduits in direct sunlight can be expected to heat up well above the nominal outdoor temperature. The data suggest that a conservative 30°F (17°C) should be added to nominal outdoor temperatures in applying temperature correction factors in these cases.
Both bench-top and field work are continuing on these and other experiments.
Introduction
TheNational Electrical Coderequires that ampacity corrections be made for cables exposed to ambient temperatures higher than nominal values. Current passing through a wire generates I2R heat, which adds to the temperature from outside the wire, further heating up the copper wire, insulation and jacketing. The ampacity correction factors are published in Tables 310.16 through 310.20 in the 2002NEC.
When the derating tables are not applied in practice —and they often are not — serious consequences can result. Overloaded wires can sometimes heat to beyond their rated capacity — 194°F (90°C) per Code in most cases — resulting in permanent damage to the plastic insulation and jacketing, and fire hazards as well. Even when they do not exceed their temperature rating, they may operate for significant periods of time at high temperatures that waste energy, putting additional loads on air-conditioning equipment. In general, heat is the enemy of electrical equipment, whether transformers, motors or cable, and the cooler a product runs the longer it can be expected to last.
An engineer, contractor or inspector seldom knows what temperatures a given cable will be exposed to in buildings, since there are many variables (roof material or color, degree of ventilation, other heat-generating equipment in the space, etc.). Without this knowledge it is next to impossible to accurately impose temperature-correction factors, and so the subject is often ignored.
When electrically loaded cables are “bundled” together in a restricted area, a further heating effect could cause safety problems under real-world conditions. It has even been suggested that a “”runaway”” situation can occur in some cases, where I2R heat from the loaded conductors, being unable to escape, further heats the conductor, thus raising the conductor resistance, which causes more I2R heating, increasing the temperature still further, and that this cycle can continue to lead to failure.
The National Electrical Code addresses bundling in Section 310.15(B)(2)(a). Here the description of a bundle is restricted to having a minimum length of 600 mm (24 in.), and no suggestion is made that a shorter bundle needs to be derated.
Another area of concern occurs when electrical wiring in conduits is installed outdoors in direct sunlight. It has been suggested that heating occurs well in excess of the nominal outdoor temperature.
Presently the NEC does not contain provisions for adjustment of conductor ampacities for the effects of bundling of short lengths or of direct solar exposure. It has been suggested that Code provisions related to these issues have not been implemented due to the lack of sound quantitative data. With no Code provisions in place, both subjects — bundling and direct solar exposure — are undoubtedly widely ignored.
In the course of conducting an Elevated Ambient Temperature Study (EATS) in residential and non-residential structures, Copper Development Association Inc. (CDA) included one bundle of NM-type cables in a residential-type structure, to determine if there were safety issues during heavy, but Code-acceptable, levels of loading. Since it is common for bundled cables to pass through top plates in walls above load centers and at other locations containing a concentration of electrical applications, a top plate was used for the bundle experiment. CDA also included several samples consisting of conduit containing insulated conductors outdoors in direct sunlight.
IAEI Ambient Temperature Survey
Many inspectors attending the 2002 fall meetings of the five U.S. IAEI sections participated in a survey conducted by CDA to determine the prevailing attitudes among inspectors on ambient temperature corrections. A total of 512 inspectors and other attendees completed the survey, representing a high percentage of all attendees.
On a scale of 1 to 10, respondents rated the importance of ambient temperature corrections to be a 7.1. Over half the respondents (56%) felt that the rules for ambient temperature correction are not being effectively enforced, and about the same number (58%) felt that summer temperatures in their jurisdiction warrant ampacity corrections. Not surprisingly, those in the South (72%), Southwest (66%) and West (65%) sections were most concerned, followed by the East (51%) with the Northwest section least concerned (43%).
But are circuits being derated? Inspectors indicated that they are in 18% of exterior conduits, 16% of commercial under-roof areas, 17% of residential attics and 9% of exterior walls. On this question there was some possibility of misunderstanding, since the supplementary comments in the survey showed that some respondents interpreted the question to mean that those spaces were subject to derating, as opposed to changes actually being made, particularly the upsizing of wire. CDA will try to clarify this point in a future survey.
When the respondents were asked whether, in applying temperature correction factors, they would find it helpful to have data that correlates outdoor temperatures in their area with actual temperatures in various building spaces, such as residential attics, commercial under-roof spaces, walls and exterior conduits, nearly 90 percent said yes. The EATS project was created to help resolve these important issues.
Experimental Procedure
Buildings.The experiments are being conducted in a single-story 10-foot by 12-foot simulated
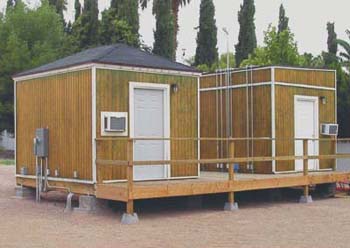
Figure 1. Test residential structure (left) and commercial structure (right)
residential building and a 10-foot by 12-foot simulated commercial building (figure 1) at CDA’s research site in Las Vegas, Nevada, starting in the summer months of 2002 and to continue some time into the future.
The residential building is a freestanding wood-framed structure with a hip-type roof with a slope of (4 in.) in (12 in.) on all four sides. The building is oriented so that one 12-foot wall (in which the bundling experiment was conducted) faces south, the wall to the left in the picture. The exterior height of the roof at the peak is approximately 11 feet above floor level. The roof is sheathed with ½-inch plywood and covered with two layers of 15-pound roofing felt and one layer of GAF charcoal asphalt shingles.
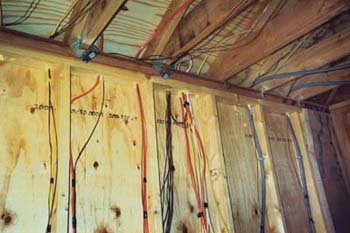
Figure 2. Interior south wall of residential building
The building has wall framing of 2 x 4 Douglas fir #2 on 16-inch centers. Exterior sheathing is 5/8-inch T1-11 wood siding, while interior walls are 5/8-inch gypsum drywall. The ceiling is 5/8-inch gypsum drywall. Ceiling insulation consists of R-19 fiberglass batts faced with kraft paper on the interior side. Wall insulation is R-13 fiberglass batts faced with kraft paper on the interior side. The attic is ventilated at 1/150th of the attic area using circular eave vents in the small overhang in each joist space.
The commercial building is a freestanding steel-framed structure with a flat roof having a slope of one-half inch in twelve inches.
The exterior height of the roof is approximately 10 feet above floor level. The roof is sheathed with ½-inch plywood and covered with two layers of 30-pound felt paper, and then two layers of 90-pound charcoal-colored rolled mineral faced roofing material. The direct solar exposure experiment was conducted on the roof. Exterior sheathing, interior walls and insulation are similar to the residential building.
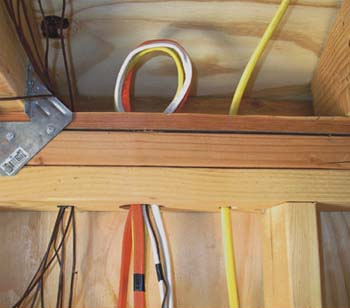
Figure 3. Bundle of 6 NM-B cables installed in top plate
The 10 x 12 x 8 foot interior space has a ceiling of 24 x 48 inch intermediate-grade lay-in tile, with R-19 fiberglass batt insulation lying on the tiles with the paper side down. The space between the ceiling and roof sheathing is unventilated.
The living space in both buildings is air conditioned to approximately 78F, though this temperature may rise temporarily when the door is opened on a hot day.
Bundling experiment — residential building
Cable bundle.The bundle consisted of a total of six NM-B cables, two each of 14/2 WG, 12/2 WG, and 10/2 WG. The bundle is located in the top plate at about the middle of the south wall of the building. The cables were of the color-coded types with jackets colored white for 14 AWG, yellow for 12 AWG and orange for 10 AWG. The bundle was located in a top plate which consisted of two 2 x 4s and one 1 x 4, for a total bundle length within the 1-1/2 hole bored vertically through the top plate of approximately 3-1/2 inches. The six cables were actually three cables passing up through the hole, then looped above the top plate and separated to minimize any bundling effects outside the hole, then passing back down through the hole. The cables were spread apart below the hole as well to minimize the length of the bundle effect. Figure 2 is a photograph of the south wall interior, and figure 3 is a close-up of the bundle before fire-stopping and installation of the fiberglass insulation and interior drywall.
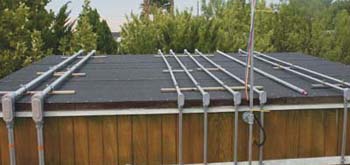
Figure 4. As shown in figure 4, conduits containing copper conductors passed over the unshaded roof from one side to the other.
Fire- and draft-stopping was accomplished in accordance with standard accepted practices using fiberglass, with some foam insulating material added from the top side to complete the seal.
Conductor loading.There were 12 loaded conductors in the 1-1/2 diameter bundle — six phase conductors and six grounded (neutral) conductors. This consisted of four 14 AWG, four 12 AWG and four 10 AWG copper conductors. The six bare grounding conductors, which carried no current, were not considered. Currents were generated using resistance loads — mineral insulated heating cables, supplemented by incandescent and halogen lamps to “fine-tune” the currents.
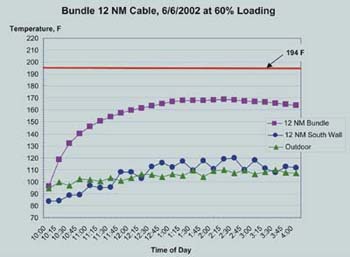
Figure 5. A typical pattern for the temperature of the unloaded cable in the south wall, the temperature of the cable in the bundle and the outdoor temperature is shown in figure 5 for June 6, 2002
At various times the cables were subjected to loads varying from 60 percent of rated loads to the limit (for continuous loads) of 80 percent. The reason for this is that it took considerable time to “fine-tune” the experiment by adjusting resistance loads. (The bundle experiment was only a small part of an overall experimental program.)
The three ranges tested are a nominal 60 percent range for the June 6–9, 2002 period, a nominal 73 percent for the July 25–31, 2002 period and a nominal 80 percent for the August 11–15, 2002 period. It should be noted again that these ranges were not preselected, but the pattern of loading resulted from evolution of the larger experimental program.
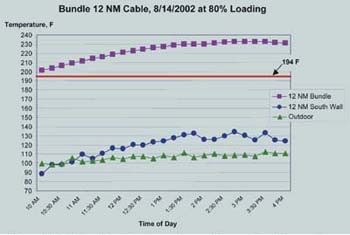
Figure 6. Figure 6 shows the same data for August 14, when the cable was loaded at 80 percent (16 amps).
Comparison Temperatures.
Outdoor temperatures were measured, using a standard six-plate solar radiation shield containing a thermocouple sensor installed in a housing. For comparison purposes temperatures were also measured within other bays of the south wall on the jackets of unloaded NM-B cables of the same type and AWG sizes as the cables in the bundle. Either of these can be considered the “base” temperature to which bundle temperatures can be compared.
Temperature measurement.Temperatures were measured using Type T copper-constantan thermocouples attached with electrical tape to the outer jackets of each of the three cables before they were bundled together. The cables were then inserted in the bored hole so that the thermocouples were positioned approximately midway in the 3-1/2 length of the hole (figure 3), and the aforementioned fire-stop materials were then applied. The sensor leads were connected to a high-capacity data logger in an adjacent building, which recorded and stored the temperatures at one-minute intervals. All tabulations were done with data at 15-minute intervals. (Note: The overall CDA experiment involved a total of about 160 temperature measurement points; hence the need for a high-capacity data logger.) The same measurement method was used for the unloaded NM cables in other stud bays of the south wall of the building, which were used for comparison.
Solar rise experiment — commercial building
Samples.As shown in figure 4, conduits containing copper conductors passed over the unshaded roof from one side to the other. Half the conduits contained electrically loaded conductors and half contained unloaded conductors. For the test reported herein, only the unloaded conductors were considered.
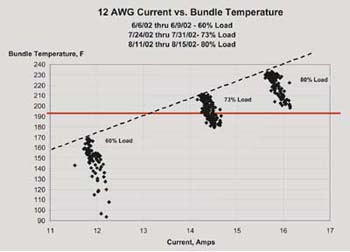
Figure 7. The relationship of bundle temperature and degree of electrical loading is shown in figure 7, again for 12 AWG cable, with very similar results for 14 AWG and 10 AWG cables.
Conductor samples consisted of THHN conductors rated at 90°C, enclosed in ¾-inch electrical metallic tubing (EMT). Each conduit contained two insulated phase conductors and one insulated equipment-grounding conductor. Separate conduits contained 14 AWG, 12 AWG, 10 AWG and 4 AWG samples. (For 4 AWG conductors 1-1/4 inch conduit was used.) The conduit was purchased new in the spring of 2002 and retained its shiny appearance through the test period in the desert climate of Nevada. Conduits were fastened to the structure using metal strut supports and strut clamps, which raised them 5/8 inch above the roof level, thus permitting air circulation around the conduits. The conduits and fittings used in the experiment are rated for outdoor use. Conduit fittings were compression style.
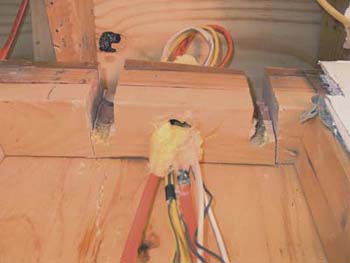
Figure 8. Finally, figure 8 shows the bundle after exposure to the conditions described, after the drywall was removed and before the top plate containing the bundle was taken out for further examination.
For comparison one section of 1-inch conduit containing unloaded 4 AWG conductors was placed flat on the roof to determine if the 5/8-inch spacing had any effect on conductor temperatures. It should be noted that placing conduits directly on flat roofs is fairly common practice, and it is not unusual for these conduits to eventually be secured with roofing tar.
Temperature measurement.Conductor temperatures were measured using copper-constantan thermocouples attached with electrical tape to the insulation of one of the conductors within each conduit. The location of the thermocouples was approximately midway across the width of the roof.
Results
Bundling experiment — residential building
A typical pattern for the temperature of the unloaded cable in the south wall, the temperature of the cable in the bundle and the outdoor temperature is shown in figure 5 for June 6, 2002. By 10 a.m. the current is just being turned on and the bundle temperature is 12°F higher than that of the unloaded cable, and about the same as the outdoor temperature. As the effect of the 60 percent current (12 amps for the 12 AWG wire shown here) becomes apparent the cable in the bundle heats up considerably higher than the unloaded wires, the latter staying about the same as the outdoor temperature. The difference between the loaded and unloaded wires reaches a peak of about 58°F at 3:30 p.m.
Figure 6 shows the same data for August 14, when the cable was loaded at 80 percent (16 amps). This day actually had about the same outdoor temperature as June 6, with most of the day in the 100–110°F range. Here the loaded cable is above the 194°F limit over the entire 10 a.m.– 4 p.m. period, and runs as much as 109°F hotter than the unloaded cable. Of special note is that the cable temperature reaches a peak temperature of 233°F at 2:45 p.m. This latter temperature is nearly 40°F higher than the allowable limit for 90°C (194°F) cable.
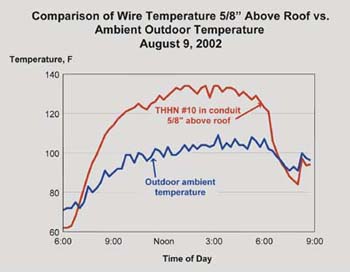
Figure 9. Figure 9 shows data for 10 AWG insulated wire for August 9, 2002 from 6 a.m. to 9 p.m.
The relationship of bundle temperature and degree of electrical loading is shown in figure 7, again for 12 AWG cable, with very similar results for 14 AWG and 10 AWG cables. In this figure, all the 15-minute data points for the three time periods were plotted. The results show up as three clusters of data points. The lower left cluster is for the June 6–9 period at about 60 percent loading, the middle cluster was for the July 24–31 period at 73 percent loading, and the upper right cluster is for 80 percent loading in the August 11–15 period. This figure shows dramatically that 60 percent is a “safe” level, at least in terms of the bundle temperature remaining below the critical 194°F rating of the cable. Seventy-three percent loading, on the other hand, resulted in many points being above the critical temperature, and at the Code limit of 80 percent loading every single data point was above 194°F during this hot week in August. The line drawn above the three clusters crosses the 194°F line at about 13 amps, or 65 percent loading, indicating potential problems if higher loading is done.
Finally, figure 8 shows the bundle after exposure to the conditions described, after the drywall was removed and before the top plate containing the bundle was taken out for further examination. Discoloration of the wire jackets was seen and the fire-stop material showed signs of overheating. Subsequent testing confirmed severe degradation of the cable insulation and jacketing materials.
No fires or short circuits resulted from the experiment, but undoubtedly dangerous conditions were present in the top-plate bundle.
Solar rise experiment — commercial building
Figure 9 shows data for 10 AWG insulated wire for August 9, 2002 from 6 a.m. to 9 p.m. For about 12 hours — 7 a.m. to 7 p.m. — the temperature of the cable in the conduit is significantly higher than the outdoor temperature, rising to as high as 134°F when the outdoor temperature is 101° F. The temperature differential during the heat of the day never fell below 20°F from 9 a.m. to 5 p.m.
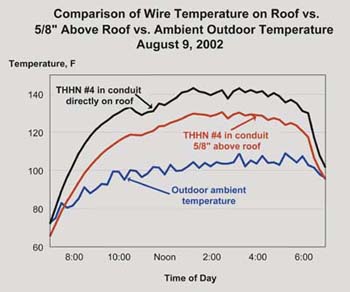
Figure 10. Similar data are shown for 4 AWG wire in figure 10 (bottom and middle lines).
Similar data are shown for 4 AWG wire in figure 10 (bottom and middle lines). The temperature differential in this larger conductor shows the same pattern as for 10 AWG, although it runs somewhat cooler, presumably because the greater bulk of conductor allows some of the heat to be dissipated along its length.
The top line in figure 10 represents the temperature of the 4 AWG conductor in conduit lying flat on the roof in contact with the black roll roofing. Here we see that the conductor in this conduit is even hotter than the sample 5/8 inch above the roof, ranging from 10°F to 14°F hotter during the day shown. Over a 1-1/2 month period from late July to early September 2002, and between the hours of 7 a.m. and 7 p.m., the average differential between the two samples was 9.1°F, reaching a maximum of 15.8°F.
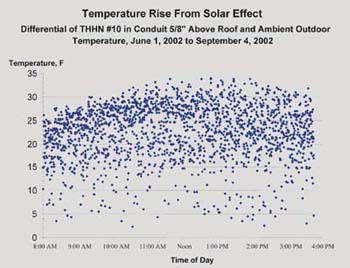
Figure 11. Figure 11 is a scatter chart of all the data points for the 10 AWG sample between 8 a.m. and 4 p.m. during the period from June 1 through September 4, 2002.
Figure 11 is a scatter chart of all the data points for the 10 AWG sample between 8 a.m. and 4 p.m. during the period from June 1 through September 4, 2002. The temperature plotted is the differential between outdoor temperature and conductor temperature in the conduit raised 5/8 inch above the roof. The densest cluster occurs in the 2030°F range and many points are above 30°F.
Ongoing Research
Following the 2002 field experiments it was decided to better define the parameters of the bundling and solar-rise issues by conducting more work. The bundling work is being done in a bench-top experiment while the solar-rise work involves more rooftop conduits.
Bench-top experiments. A test rig was constructed to conduct bundle and other experiments in a timelier manner than was possible in the field experiments (figure 12). A view of a bundle experiment is shown in figure 13 with the drywall removed for viewing. Thermostatically controlled tungsten-halogen lamps in the rig simulate the action of the sun as it heats up the attic and south wall of the residential building. The performance of the unit has been verified against the field experiments. When the “”attic”” section of the rig is controlled, for example, at 160°F, the bundle with all cables carrying 80 percent loading is within a few degrees of the temperature found in the bundle in the field experiment when the attic temperatures were 160°F.
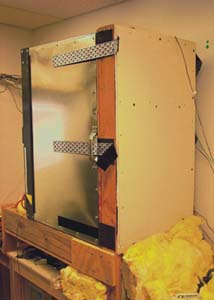
Figure 12. Bench-top experiments. A test rig was constructed to conduct bundle and other experiments in a timelier manner than was possible in the field experiments
Many bundle configurations are being tested, with many patterns of loading, and at various attic temperatures. Detailed results will be available late in 2003.
Solar-rise experiments.As shown in figure 14, twenty-one rooftop conduits have been added to the experiment in the spring of 2003. In addition to the electrical metallic tubing (EMT), intermediate metal conduit (IMC) and rigid nonmetallic conduit (RNC) are being tested. Since it would be expected that weathered or dark-colored conduit would absorb more solar energy and that the conductors within would reach even higher temperatures than is the case with shiny conduit, some EMT conduits have been acid-treated to simulate weathering. Others are lying directly on the roof or are tarred to the roof.
After one month of data gathering (May–June 2003) preliminary results have shown significant temperature rises in the various conduit configurations. When maximum outdoor temperatures over that period of time are compared to temperatures on the unloaded conductors in the various conduits, all show temperature rises in the 28–58°F range. More work is needed before conclusions are drawn.
Conclusions
Bundling Experiment.The bundling experiments show the possibility of dangerous conditions when loaded circuits are brought into close proximity with each other inside a fire- or draft-stop, where the ability to dissipate heat is extremely limited. Bundles are referred to in NEC 310.15(B)(2) Exc. 5, which includes a requirement for at least 24-inch length, and there appears to be little doubt that bundles of much shorter length should be subject to derating.
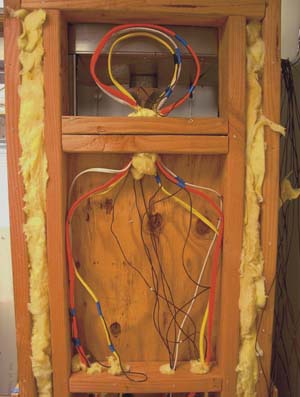
Figure 13. A view of a bundle experiment is shown in figure 13 with the drywall removed for viewing.
It may be argued that principles of load diversity should be applied to cable bundles, particularly in residential applications, and that 80 percent loading of all the cables in a bundle will seldom occur. On the other hand, it can be equally argued that the 80 percent limit will be exceeded in numerous situations, at least in one cable in a bundle. Also, in other cases where diversity principles are used, overcurrent devices provide protection against overloading. In this case the amperages are well below levels that would trip the overcurrent devices.
The excessive heating of the cable and the surrounding wood structure provides an obvious hazard, even though no fires or short circuits have yet occurred. Severe degradation of the insulation was found in subsequent examination of the samples, as might be expected as a result of the cumulative effect of time at excessive temperatures.
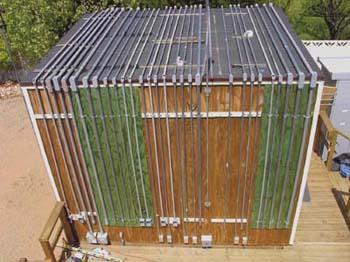
Figure 14. Solar-rise experiments. As shown in figure 14, twenty-one rooftop conduits have been added to the experiment in the spring of 2003.
Although experimental work is continuing, preliminary results indicate that immediate adjustments should be made to the NEC to apply at least to the specific case represented by the CDA experiment. Such a proposal for the 2005 NEC has been made, as Proposal CP 700 (originally Proposal 6-31).
Solar Rise Experiment.Research shows that a temperature rise can be expected for any conductor within a raceway or cable installed outdoors in direct sunlight. Data indicate that a rise of 30°F and more can be expected for any conduits in direct sun on a hot day. Likewise, the data show that, when the conduit lies directly on the dark roof surface, more than 10°F additional can be added to the temperature of the conductors within the conduit.
Since maximum outdoor temperatures in various regions of the USA are well known to electrical designers, contractors and inspectors, it is suggested that, for conduits and raceways exposed to direct sunlight, a standard 30°F (17°C) be added to the ambient temperatures shown in NEC Tables 310.16 and 310.18 for purposes of calculating ampacity corrections. Such a proposal for the 2005 NEC has been made, as Proposal 6-45.