Phasors
It is time to bite the bullet. Before we can continue into three-phase electrical circuits and calculations, we have to have a solid understanding of voltage and current phase angles. To do this we turn to phasors. I’m not talking about Captain Kirk’s weapon of choice. I’m talking about a graphical representation of the voltage or current magnitude in ac electric circuits at any instant in time. To get into phasors, let’s first review a little from Part 5 of this series when I introduced the idea of alternating current (ac).
Alternating Current
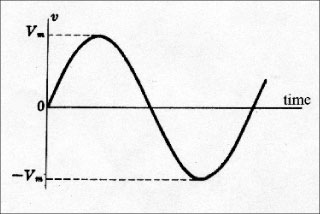
Figure 1. This graph of voltage versus time is often called a sine wave.
In ac circuits, the magnitude and polarity of the voltage and current are continuously changing. At one instant in time the current flows in one direction. A moment later, the current flows in the opposite direction. Alternating current is often pictured graphically as in figure 1 which shows voltage with respect to time. This graph of voltage versus time is often called a sine wave.
For most electric power sources in the U.S., the frequency is 60 cycles-per-second or 60 Hertz. That means that the voltage and current complete an entire cycle sixty times per second. Looking at figure 1, the voltage starts at 0 magnitude. The voltage increases with time until it gets to a maximum and then decreases with time until it gets back to 0. Then the polarity reverses and the voltage increases to a maximum negative value and then decreases down to 0. During this first half cycle, the polarity of the voltage and the corresponding current flows is in one direction. In the second half cycle, the polarity of the voltage and the corresponding current flows in the opposite direction. At this point, 1/60 of a second or 16 2/3 milliseconds have passed. The voltage reverses and starts the next cycle identical to the first cycle. When we close a switch to energize a circuit, the circuit voltage jumps from 0 to whatever the source voltage is at that instant. If the source voltage happens to be one quarter into the cycle, the circuit voltage will jump from 0 to Vm.
Phasor Diagram
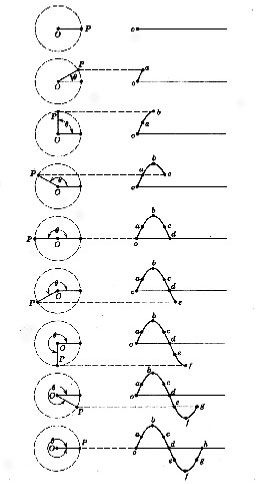
Figure 2. The relationship between the phasor diagram and the voltage or current sine wave
Just as we use the minute hand of a clock to tell us what time it is in the normal cycle of an hour, we can use a similar clock called a phasor diagram to tell us what the voltage or current magnitude is at any instant in the voltage or current cycle. The phasor diagram is similar to a traditional clock. The hand of the phasor diagram is called a phasor. The length of the phasor from the center of the circle labeled point 0 to the tip of the phasor labeled point P is proportional to the voltageVmor the currentCm. When we draw a phasor diagram, we will consider the size of our paper to choose a suitable scale forVmandCm. Unlike the clock hand, the phasor rotates counter-clockwise. For the minute hand of a clock, the cycle of one hour is divided into 60 minutes. For the phasor diagram, the voltage or current cycle is divided in to 360 degrees. One-quarter cycle becomes 90 degrees. Half cycle becomes 180 degrees. The relationship between the phasor diagram and the voltage or current sine wave is shown in figure 2. Note that the voltage or current magnitude at a particular instant in time is equal to the distance that point P is above or below the horizontal line passing through the point0(see figure 2).
Phase Angle
To understand how a phasor diagram can be used, let’s look at a few examples. In Parts 1 through 7 of this series, we considered only circuits without inductive reactance. We were dealing only with resistance. In those circuits, if we compared the current waveform to the voltage waveform, we would find that the current is always in phase with the voltage (see figure 3).
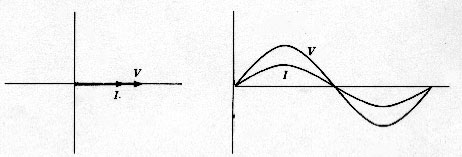
Figure 3. We were dealing only with resistance. In those circuits, if we compared the current waveform to the voltage waveform, we would find that the current is always in phase with the voltage.
In Part 8, we looked at a circuit involving an electric motor. You will recall that we could not just add the resistance and the inductive reactance together to obtain the total impedance. We had to use the impedance triangle. That is because the current in an inductance lags the voltage across it by 90 degrees. In the example of the circular saw, the load is a combination of resistance and reactance (see figure 4).
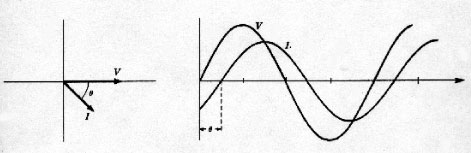
Figure 4. In the example of the circular saw, the load is a combination of resistance and reactance.
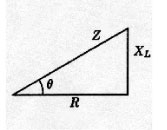
Figure 5
Note that the current lags the voltage by almost 37 degrees. This angle, often called the power angle, is the phase angle of the current relative to the voltage. If we look at the impedance triangle, the power angle is the angle q. To calculate the power angle, we take the arc tangent ofXL/ R = arc tan (5.538 / 7.384) = arc tan (0.75) = 36.86 degrees (see figure 5).
Phase Angle Meter
Another way of determining the phase angle of the current relative to the voltage is to use a phase angle meter. One example of a phase angle meter is the Utility Test Equipment Company (UTEC) Model 504 digital phase angle meter (see photo 1).
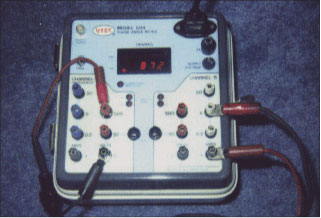
Photo 1. One example of a phase angle meter is the Utility Test Equipment Company (UTEC) Model 504 digital phase angle meter.
With this understanding of voltage and current phase angle, we will move on to three-phase electrical circuits in Part 10.