
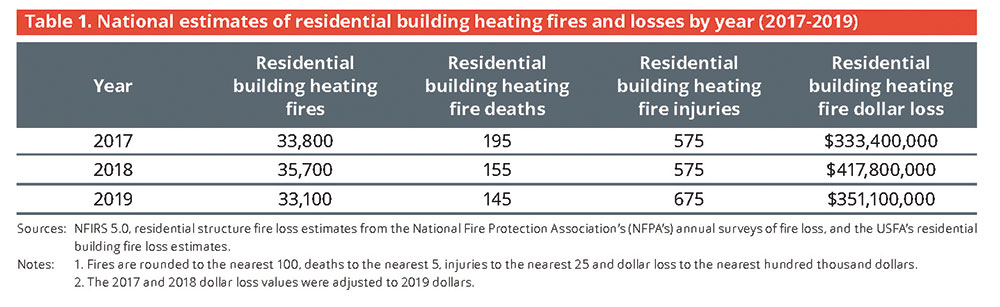
From 2017 to 2019, heating fires in residential buildings accounted for an estimated annual average of 34,200 reported fires. ¹,²,³ These fires resulted in an estimated annual average of 165 deaths, 600 injuries, and $367 million in property loss. The term “heating fires” applies to those caused by central heating units, fixed or portable local heating units, fireplaces, heating stoves, chimneys, and water heaters. ⁴
Previously, especially during the late 1970s and early 1980s, heating was, by far, the leading cause of residential building fires. Stimulated partly by an energy shortage, this surge in heating fires may be the result of the sudden increased use of alternative heating, particularly wood heating stoves and space heaters. Since then, the overall number of heating fires has substantially decreased. In 1983, there were 200,000 heating fires. Still, by 2015, that number had fallen to an estimated 41,200 heating fires and, by 2019, it fell even further to an estimated 33,100 heating fires (Table 1). ⁵,⁶ Despite this decline, from 2017 to 2019, submitted incident reporting indicates heating remained the second leading cause and accounted for 9% of all residential building fires responded to by fire departments across the nation. ⁷
As part of a series of topical reports addressing fires in residential building types, this report addresses the characteristics of residential building heating fires as reported to the NFIRS. NFIRS data are used for the analyses throughout this report.
The focus is on fires reported from 2017 to 2019, the most recent data available at the time of the analysis. ⁸ Complete or full years of data are required for statistical analyses presented in these topical reports. Although the NFIRS data for a calendar year are often reported to the USFA throughout the year, fire departments and or states have until the official cutoff date as set forth by the National Fire Data Center to submit their data to the USFA. Typically, this cutoff date is July 1 after the end of the previous calendar year. This provides states with ample time to perform data quality checks and correct questionable incidents before they are set to released status in the national production database and Enterprise Data Warehouse. Once the data are released to the USFA, additional data quality reviews are completed before the data are prepared for public release.
For this report, the term “residential heating fires” is synonymous with “residential building heating fires,” as residential heating fires commonly mean those fires caused by heating that occur in buildings. The term “residential heating fires” is used throughout the body of this report; the findings, tables, figures, headings, and endnotes reflect the full category “residential building heating fires.”
Type of fire
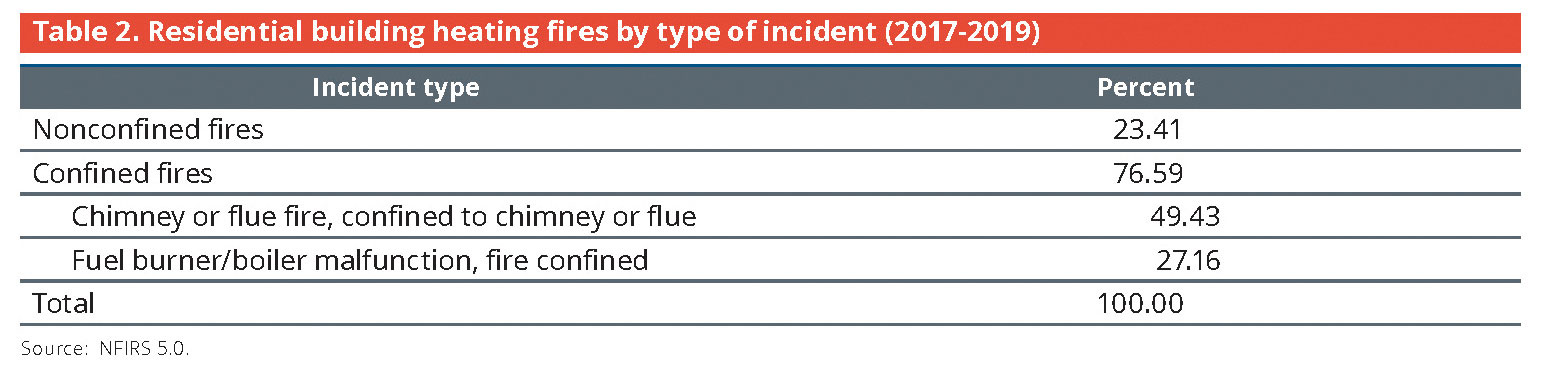
Building fires are divided into two classes of severity in NFIRS: “confined fires” and “nonconfined fires.” Confined building fires are small fire incidents that are limited in extent to specific types of equipment or objects, staying within pots, fireplaces, or certain other noncombustible containers. ⁹ Confined fires rarely result in serious injury or large content loss and are expected to have no significant accompanying property loss due to flame damage. ¹⁰ Nonconfined fires extend beyond certain types of equipment or objects. They are generally larger fires resulting in more serious injury and larger losses of property and content.
Of the two classes of severity, 77% of residential heating fires were confined fires, as shown in Table 2. By comparison, from 2017 to 2019, 51% of all residential building fires were confined fires. ¹¹
Loss measures
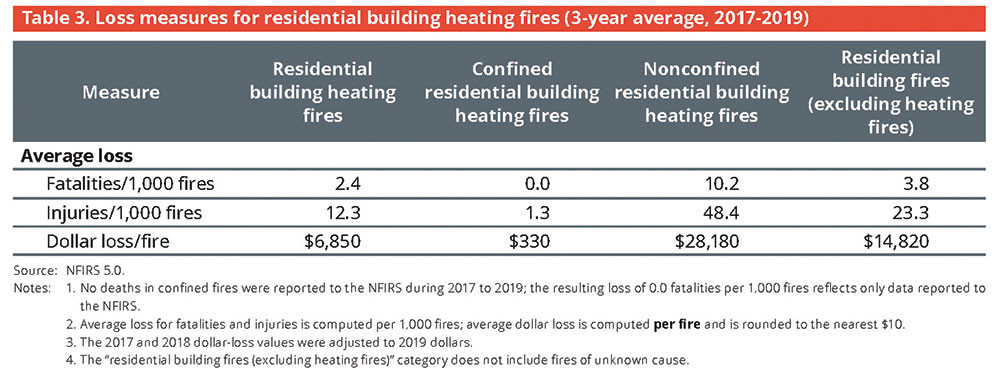
Table 3 presents losses, averaged over the 3-year period from 2017 to 2019, for residential heating fires and all other residential building fires (i.e., excluding heating fires) reported to the NFIRS. ¹² As can be expected, the average losses associated with nonconfined residential heating fires were notably high since nonconfined fires generally include larger fires that more often result in serious injury and more content losses. The average losses of fatalities, injuries, and dollar loss for residential heating fires were less than those for all other residential building fires.
Property use
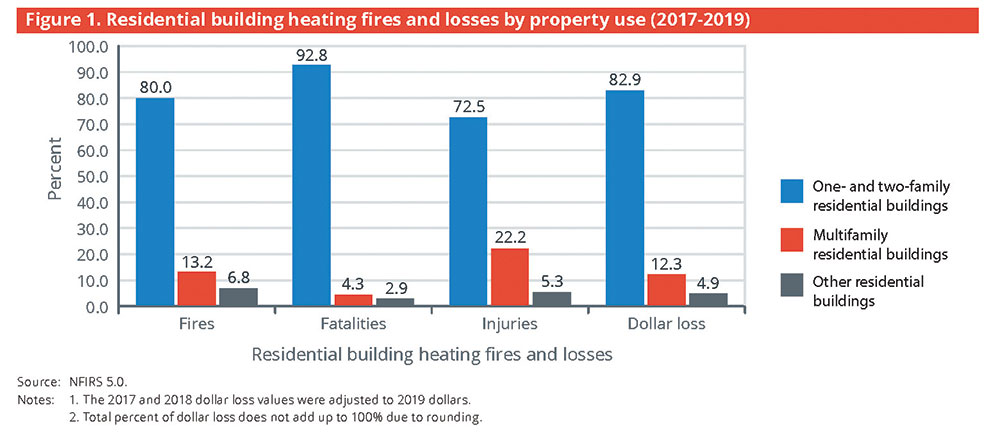
Figure 1 presents the percentage distribution of residential heating fires and losses by property use (i.e., one- and two-family residential buildings, multifamily residential buildings, and other residential buildings). ¹³ One- and two-family residences were disproportionately represented in residential heating fires. In fact, 80% of residential heating fires occurred in one- and two-family residences — yet only 63% of all residential fires occurred in these types of residences. ¹⁴ An additional 13% of residential heating fires occurred in multifamily dwellings.
Consistent with the fact that the majority (80%) of residential heating fires took place in one- and two-family residential buildings, the percentages of fatalities (93%), injuries (73%), and dollar loss (83%) were also highest in these types of residences. One reason that heating had a greater impact in one- and two-family fires than in multifamily and other residential fires is that one- and two-family residential buildings have fireplaces, chimneys, and fireplace-related equipment that most other types of residences do not have. ¹⁵ In addition, multifamily residential buildings tend to have central heating systems that are maintained by professionals and not the homeowner; thus, there are fewer heating fires from poor maintenance or misuse than in one- and two-family dwellings. ¹⁶
When residential building heating fires occur
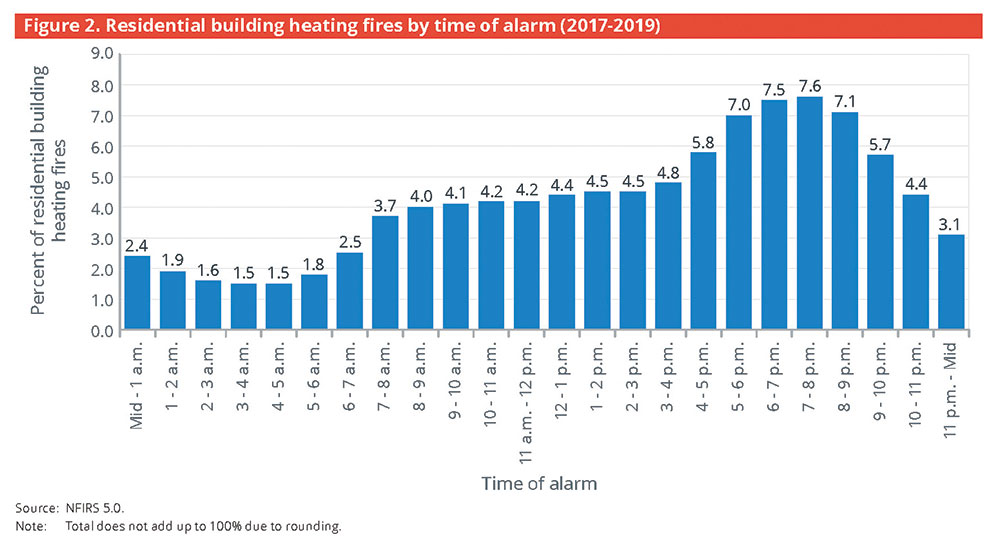
As shown in Figure 2, residential heating fires occurred most frequently in the evening hours from 5 to 9 p.m., peaking from 6 to 8 p.m. ¹⁷ These fires declined throughout the night and early morning and reached their lowest point during the morning hours from 3 to 5 a.m. The 4-hour evening period from 5 to 9 p.m. accounted for 29% of residential heating fires, and the 2-hour morning period from 3 to 5 a.m. accounted for 3%. The confined fire incidents dominated the alarm profile and produced the pronounced peaks and valleys; the nonconfined fires experienced an early morning low and an evening peak as well but were less pronounced.
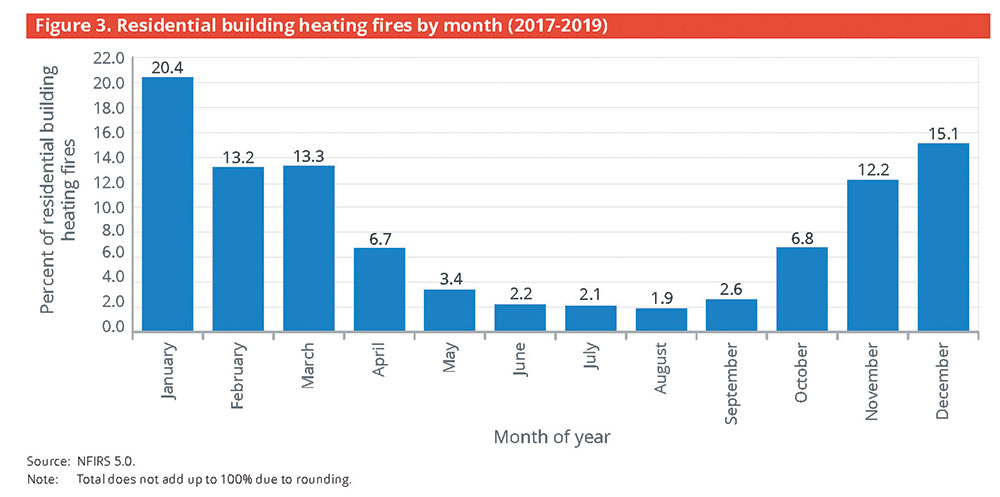
As expected, residential heating fires were most prevalent during the colder months from November through March, when the use of central heating systems, portable heaters and fireplaces is most common (Figure 3). The incidence of heating fires peaked in January at 20%. From March to August, fires rapidly declined and reached their lowest point during June, July and August (each at 2%). These months generally correspond to when home heating activities are reduced. Confined fuel burner/boiler malfunction fires accounted for 45% of the heating fires that occurred during these 3 warmer months. Additionally, both confined and nonconfined residential heating fires also followed the overall pattern of winter peaks and summer lows.
Fire spread in residential building heating fires
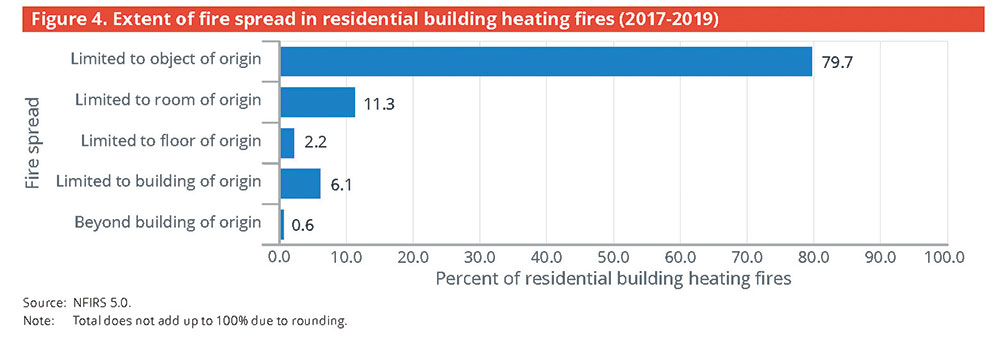
In 80% of residential heating fires, the fire was limited to the object of origin (Figure 4). These fires were primarily coded as “confined fires” in the NFIRS — 93% of residential heating fires limited to the object of origin were coded as confined fires. Few fires (9%) extended beyond the room
of origin.
Confined fires
The NFIRS allows abbreviated reporting for confined fires, and many reporting details of these fires are not required, nor are they reported. Note that not all fires limited to the object of origin are counted as confined fires in the NFIRS. ¹⁸ For example, a fire contained to a chair or clothes dryer is not defined as a “confined fire” in the NFIRS because of the greater potential for spread. Unlike fires in pots or chimneys, there is no container to stop the fire, even though the fire did not spread beyond the object of origin.
Confined residential heating fires accounted for 77% of residential heating fire incidents and dominated the “time of alarm” profile. The number of confined residential heating fires was greatest during the hours from 5 to 9 p.m., when they accounted for 83% of the residential heating fires that occurred during this period. Confined residential heating fires peaked in January, declined through May, and were lowest during the months of June, July and August.
Nonconfined fires
The next sections of this topical report address nonconfined residential heating fires — the larger and more serious fires — where more detailed fire data are available, as they are required to be reported in the NFIRS.
Where nonconfined residential building heating fires start (area of fire origin)
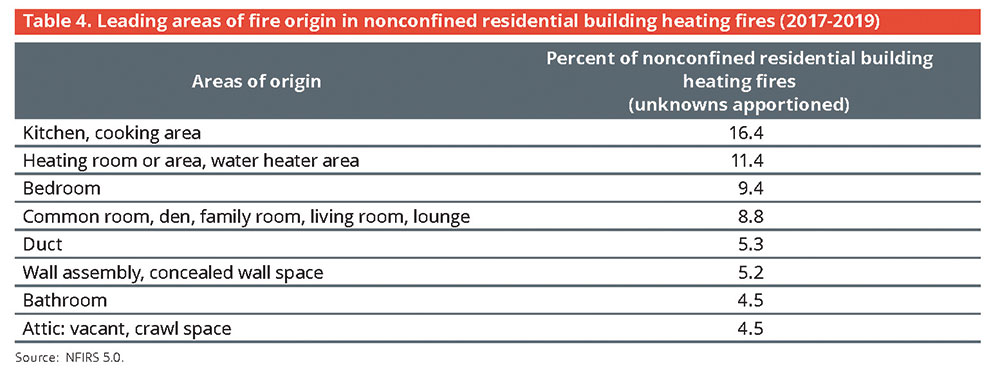
Kitchens and cooking areas (16%), rooms that contain heating equipment or water heaters (11%), bedrooms (9%), family rooms or living rooms (9%), ducts (5%), and walls or concealed wall spaces (5%) were the 6 leading areas of fire origin in the home — accounting for 57% of nonconfined residential heating fires (Table 4). In an additional 9% of nonconfined residential heating fires, the fire originated in bathrooms (5%) and attic areas (5%). ¹⁹
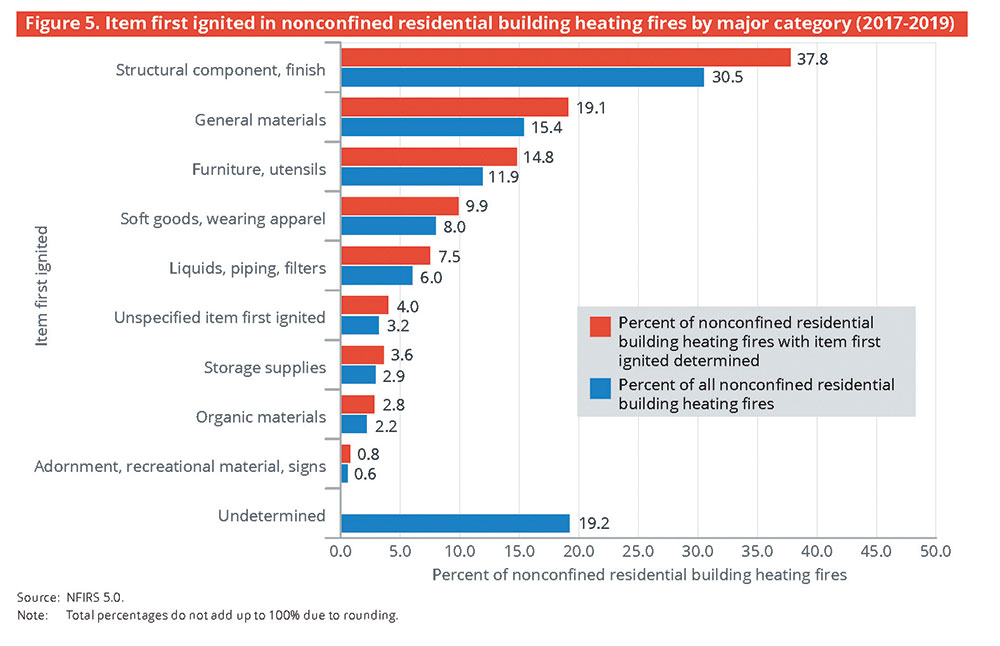
What ignites first in nonconfined residential building heating fires
Figure 5 shows that 38% of the items first ignited in nonconfined residential heating fires fell under the “structural component, finish” category. This category includes structural members or framing; exterior trim and finishes; interior wall coverings; and insulation within the walls, partitions and floor/ceiling surfaces. The second leading category was “general materials,” a catchall category that includes items such as electrical wire insulation, trash/rubbish and residues (such as chimney residue). “General materials” accounted for an additional 19% of nonconfined residential heating fires.
Structural members or framing (14%) and electrical wire and cable insulation (13%) were the specific items most often first ignited in nonconfined residential heating fires. In an additional 12% of nonconfined residential heating fires, other miscellaneous structural components or finishes (6%) and appliance housing or casings (6%) were the items first ignited.
Equipment involved in ignition of nonconfined residential building heating fires
Five types of equipment were involved in the ignition of 75% of nonconfined residential heating fires (including the unspecified heating category). These leading types of equipment involved in ignition of nonconfined residential heating fires, as shown in Table 5, were heating stoves (20%); unspecified heating equipment (17%); heaters including floor furnaces, wall heaters and baseboard heaters (15%); water heaters (12%); and furnaces (11%). “Heaters” include floor furnaces, wall heaters and baseboard heaters. ²⁰ “Water heaters” include sink-mounted instant hot water heaters and water bed heaters. “Furnaces” include local and central heating units.
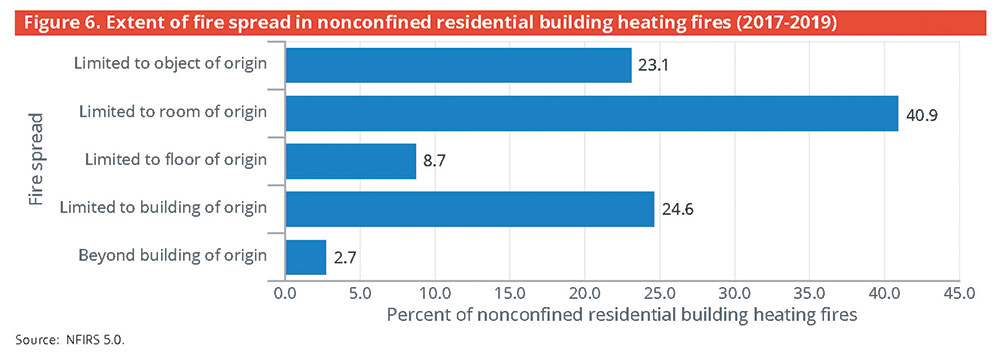
Fire spread in nonconfined residential building heating fires
Figure 6 shows the majority of nonconfined residential heating fires (64%) were limited to the object (23%) or room (41%) of fire origin. ²¹ The fire spread profile for nonconfined residential heating fires followed a pattern similar to the fire spread profile for all nonconfined residential fires, with more nonconfined heating fires being limited to the room or object of origin. ²²
Factors contributing to ignition in nonconfined residential building heating fires
Table 6 shows the categories of factors contributing to ignition in nonconfined residential heating fires. “Misuse of material or product” was the leading category contributing to the ignition of nonconfined residential heating fires at 34% and includes factors such as heat source too close to combustibles and abandoned or discarded materials or products. “Operational deficiency” was the second leading category and contributed to 23% of nonconfined residential heating fires. This category includes factors such as unattended equipment, equipment accidentally turned on or not turned off, and failure to clean equipment. “Electrical failure or malfunction” was the third leading category at 21%. These 3 categories accounted for 77% of nonconfined residential heating fires. ²³
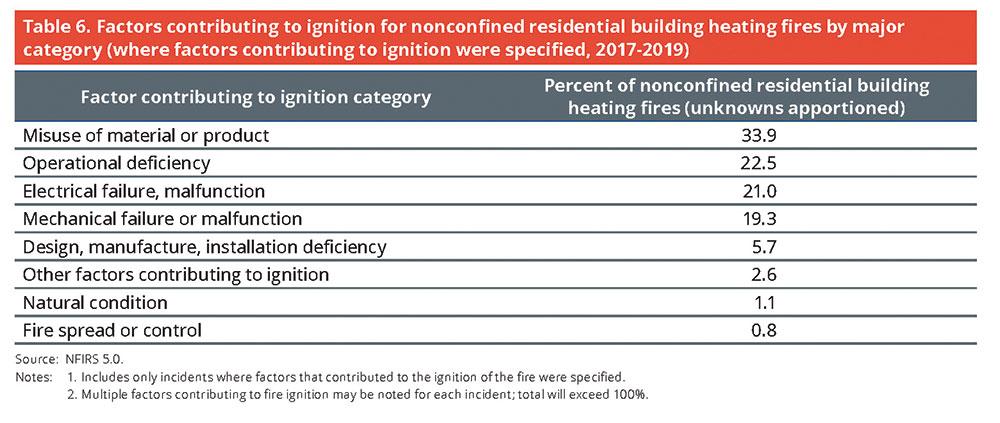
Heat source too close to combustibles (27%) was by far the leading specific factor contributing to ignition. This specific factor was twice that of the second leading factor contributing to ignition, which was miscellaneous mechanical failure/malfunction (13%).
Alerting/suppression systems in residential building heating fires
Fire fatalities and injuries have declined over the last 40 years, partly due to new technologies to detect and extinguish fires. Smoke alarms are present in most homes. In addition, residential sprinklers have gained support from the fire service and many communities.
Smoke alarm data are available for both confined and nonconfined fires, although for confined fires, the data are very limited in scope. Since different levels of data are reported on smoke alarms in confined and nonconfined fires, the analyses are performed separately. The data presented in Tables 8 and 9 show the reported counts from the NFIRS dataset. These counts are not scaled to national estimates of smoke alarms in residential heating fires. In addition, the NFIRS does not allow for the determination of the type of smoke alarm (i.e., photoelectric or ionization) or the location of the smoke alarm with respect to the area of fire origin.
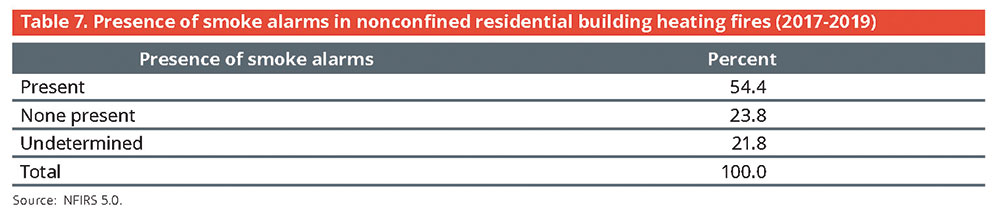
Smoke alarms in nonconfined residential building heating fires
Smoke alarms were reported as present in 54% of nonconfined residential heating fires (Table 7). In 24% of nonconfined residential heating fires, there were no smoke alarms present. In another 22% of these fires, firefighters were unable to determine if a smoke alarm was present. Therefore, smoke alarms were potentially missing in 22% to 46% of these fires that had the ability to spread and possibly result in fatalities.
While only 5% of all nonconfined residential heating fires occurred in residential buildings that were not currently or routinely occupied, these buildings — which were under construction, undergoing major renovation, vacant and the like — are unlikely to have alerting and suppression systems that are in place and, if in place, that are operational. In fact, only 24% of all nonconfined heating fires in unoccupied residential buildings were reported as having smoke alarms that operated. As a result, the detailed smoke alarm analyses in the next section focus on nonconfined heating fires in occupied residential buildings only.
Smoke alarms in nonconfined heating fires in occupied residential buildings
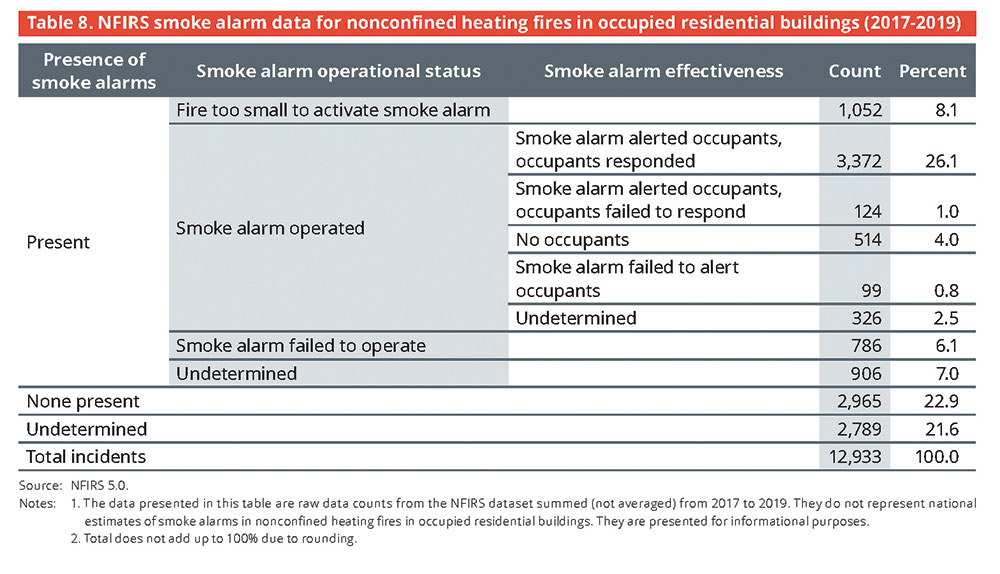
Smoke alarms were reported as present in 56% of nonconfined heating fires in occupied residential buildings (Table 8). In 23% of nonconfined heating fires in occupied residential buildings, there were no smoke alarms present. In another 22% of these fires, firefighters were unable to determine if a smoke alarm was present. ²⁴ Unfortunately, in 36% of the fires where the presence of a smoke alarm was undetermined, either the flames involved the building of origin or spread beyond it. Since the fires were so large and destructive, it is unlikely that the presence of a smoke alarm could be determined.
When smoke alarms were present (56%) and the alarm operational status was considered, the percentage of smoke alarms reported as present consisted of:
- Present and operated — 34%.
- Present but did not operate — 14% (fire too small,
8%; alarm failed to operate, 6%). - Present but operational status unknown — 7%. ²⁵
When only the subset of incidents where smoke alarms were reported as present was analyzed, smoke alarms were reported to have operated in 62% of the incidents and failed to operate in 11%. In another 15% of this subset, the fire was too small to activate the alarm. The operational status of the alarm was undetermined in 13% of these incidents. ²⁶
Properly installed and maintained smoke alarms provide an early warning signal to everyone in a home if a fire occurs.
Smoke alarms help save lives and property.
The USFA continues to partner with other government agencies, non-government organizations, and fire service organizations to improve and develop new smoke alarm technologies. More information on smoke alarm technologies, performance, training bulletins, and public education and outreach materials can be found at http://www.usfa.fema. gov/prevention/technology/smoke_fire_alarms.html. Additionally, the USFA’s position statement on home smoke alarms is available at https://www.usfa.fema.gov/about/smoke_alarms_position.html.
Smoke alarms in confined residential building heating fires
Less information about smoke alarm status is reported for confined fires, but the data still give important insights about the effectiveness of alerting occupants in these types of fires. It is especially important to look at the limited information provided for these fires, since 77% of residential heating fires were confined fires. The analyses presented here do not differentiate between occupied and unoccupied residential buildings, as this data detail is not required when reporting confined fires in the NFIRS. However, an assumption may be made that confined fires are fires in occupied housing, as these types of fires are unlikely to be reported in residential buildings that are not occupied.
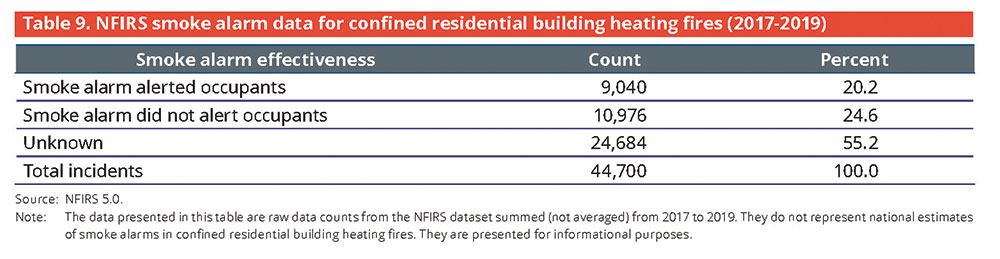
Smoke alarms alerted occupants in 20% of the reported confined residential heating fires (Table 9). Occupants were not alerted by the smoke alarm in 25% of the confined fires. ²⁷ In 55% of these confined fires, the smoke alarm effectiveness was unknown.
Automatic extinguishing systems in nonconfined heating fires in occupied residential buildings
AES data are available for both confined and nonconfined fires, although for confined fires, the data are also very limited in scope. In confined residential building fires, an AES was present in only 1% of reported incidents. ²⁸,²⁹ In addition, the following AES analyses focus on nonconfined heating fires in occupied residential buildings only, as even fewer AESs are present in unoccupied housing.
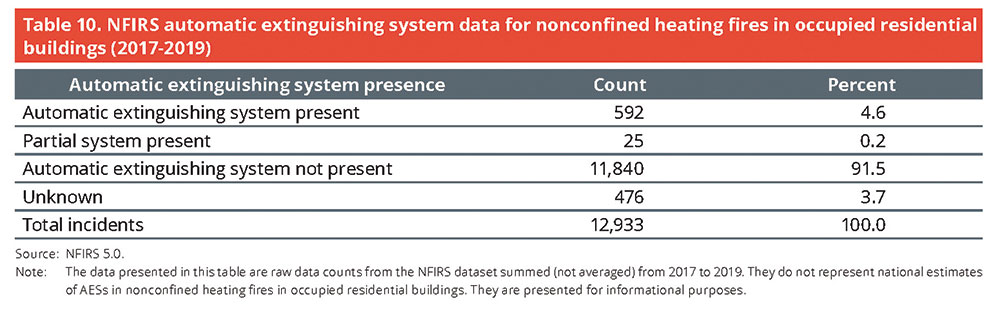
Full or partial AESs were present in only 5% of nonconfined heating fires in occupied residential buildings (Table 10). While the use of residential sprinklers is widely supported by the fire service and is gaining support within communities, the lack of AESs is not unexpected, as they are not yet widely installed. In fact, AESs were present in only 5% of all nonconfined fires in occupied residential buildings. ³⁰
Residential sprinkler systems help to reduce the risk of deaths and injuries, homeowners’ insurance premiums, and uninsured property losses. Despite these advantages, many homes do not have AESs, although they are often found in hotels and businesses. Sprinklers are required by code in hotels and many multifamily residences. There are major movements in the U.S. fire service to require sprinklers in all new homes. At present, however, they are largely absent in residences nationwide. ³¹
The USFA and fire service officials across the nation are working to promote and advance residential fire sprinklers. More information on costs and benefits, performance, training bulletins, and public education and outreach materials regarding residential sprinklers is available at http://www.usfa.fema.gov/prevention/technology/home_fire_sprinklers.html . Additionally, the USFA’s position statement on residential sprinklers is available at http://www.usfa.fema.gov/about/sprinklers_position.html .
Examples
The following are recent examples of residential heating fires reported by the media:
- February 2021: An early morning Houston, Texas, house fire killed 3 elementary school-aged children and their grandmother. As firefighters arrived at the scene around 2 a.m., the house was fully engulfed in flames and the children’s mother and her friend were outside of the home suffering from burns. Firefighters had to restrain the mother from going back inside the house. It is believed that the fire started when the family was using the fireplace to keep warm after their neighborhood had been without power for over eight hours. ³²
- February 2021: A fire in a fireplace reportedly caused a blaze at an older Morrison, Colorado, home on a Sunday night. As the family of the home was using the fireplace to help heat the home, the fire traveled upward between the studs in the wall and spread horizontally. The family and pets were uninjured but were displaced from the home. ³³
- January 2021: A mid-morning Des Plaines, Illinois, duplex fire killed a mother and her four daughters. Upon arrival, firefighters discovered that there were people trapped upstairs inside the 2-story, side-by-side duplex and immediately began a search and rescue operation. The victims had no way to escape, however, and it was too late for firefighters to save them. Officials were investigating a space heater as the cause of the fatal fire that reportedly started on the second floor. The father of the family was at work at the time of the fire, and it was reported that there were no working smoke alarms in the home. ³⁴
NFIRS data specifications for residential building heating fires
Data for this report were extracted from the NFIRS annual Public Data Release files for 2017, 2018 and 2019. Only
Version 5.0 data were extracted.
Residential building heating fires were defined using the following criteria:
Incident Types 111, 114, 116, 120 to 123:
| Incident Type | Description |
| 111 | Building fire |
| 114 | Chimney or flue fire, confined to chimney or flue |
| 116 | Fuel burner/boiler malfunction, fire confined |
| 120 | Fire in mobile property used as a fixed structure, other |
| 121 | Fire in mobile home used as fixed residence |
| 122 | Fire in motor home, camper, recreational vehicle |
| 123 | Fire in portable building, fixed location |
Note: Incident Types 114 and 116 do not specify if the structure is a building.
Incidents with Aid Types 3 (mutual aid given) and 4 (automatic aid given) were excluded to avoid counting a single incident more than once.
Property Use Series 400, which consists of the following:
| Property Use | Description |
| 400 | Residential, other |
| 419 | One- or two-family dwelling, detached, manufactured home not in transit, duplex |
| 429 | Multifamily dwelling |
| 439 | Boarding/rooming house, residential hotels |
| 449 | Hotel/motel, commercial |
| 459 | Residential board and care |
| 460 | Dormitory-type residence, other |
| 462 | Sorority house, fraternity house |
| 464 | Barracks, dormitory |
Structure Type:
For Incident Types 114 and 116:
1 — Enclosed building, or
2 — Fixed portable or mobile structure, or
Structure Type not specified (null entry).
For Incident Types 111 and 120 to 123:
1 — Enclosed building, or
2 — Fixed portable or mobile structure.
The USFA Structure Fire Cause Methodology was used to determine residential building heating fire incidents.36 Heating fire incidents involving heating stoves and food were believed to be cooking fires. As a result, fires with equipment involved in Ignition Code 124 (stove, heating) and Item First Ignited Code 76 (cooking materials, includes edible materials for man or animal, excludes cooking utensils) were excluded from the heating cause category.
Although voluntary, the NFIRS is the world’s largest national annual database of fire incident information. By contributing to the NFIRS, the fire service is helping to make data-based decisions from local budget development to the identification of national preparedness initiatives. It is important that fire departments participate in the NFIRS and critical that the data they report is complete and accurate so that sound decisions can be made that have an impact on community risk and emergency response.
The analyses contained in this report reflect the current methodologies used by the USFA. The USFA is committed to providing the best and most current information on the U.S. fire problem and continually examines its received data and methodology to fulfill this goal. Because of this commitment, data collection strategies and methodological changes are possible and do occur. As a result, analyses and estimates of the fire problem may change slightly over time. Previous analyses and estimates on specific issues (or similar issues) may have used different methodologies or data definitions and may not be directly comparable to the current ones.
Information regarding the USFA’s national estimates for residential building fires, as well as the data sources used to derive the estimates, can be found in the document “Data Sources and National Estimates Methodology Overview for the U.S. Fire Administration’s Topical Fire Report Series (Volume 21),” https://www.usfa.fema.gov/downloads/pdf/statistics/data-sources-and-national-estimates-methodology-vol21.pdf . This document also addresses the specific NFIRS data elements analyzed in the topical reports, as well as “unknown” data entries and missing data.
To request additional information, visit: http://www.usfa.fema.gov/contact.html.
Notes:
- National estimates are based on 2017 to 2019 native Version 5.0 data from NFIRS, residential structure fire loss estimates from the NFPA’s annual surveys of fire loss, and the USFA’s residential building fire loss estimates: http://www.usfa.fema.gov/data/statistics/order_download_data.html. Further information on the USFA’s residential building fire loss estimates can be found in the “National Estimates Methodology for Building Fires and Losses,” August 2012, http://www.usfa.fema.gov/downloads/pdf/statistics/national_estimate_methodology.pdf. For detailed information regarding the NFPA’s survey methodology, see the NFPA’s “Methodology used in calculating national estimates from NFPA’s fire experience survey,” August 2020, https://www.nfpa.org/-/media/Files/News-and-Research/Fire-statistics-and-reports/US-Fire-Problem/Methodsfirelossandothers.ashx. In this topical report, fires are rounded to the nearest 100, deaths to the nearest 5, injuries to the nearest 25 and dollar loss to the nearest million dollars.
- In NFIRS Version 5.0, a structure is a constructed item of which a building is one type. In previous versions of the NFIRS, the term “residential structure” commonly referred to buildings where people live. To coincide with this concept, the definition of a residential structure fire for the NFIRS 5.0 includes only those fires where the NFIRS 5.0 Structure Type is 1 or 2 (enclosed building and fixed portable or mobile structure) with a residential property use. Such structures are referred to as “residential buildings” to distinguish these buildings from other structures on residential properties that may include fences, sheds and other uninhabitable structures. In addition, confined fire incidents that have a residential property use but do not have a structure type specified are presumed to occur in buildings. Nonconfined fire incidents that have a residential property use without a structure type specified are considered to be invalid incidents (structure type is a required field) and are not included.
- The term “residential buildings” includes what are commonly referred to as “homes,” whether they are one- or two-family dwellings or multifamily buildings. It also includes manufactured housing, hotels and motels, boarding houses or residential hotels, dormitories, sorority/ fraternity houses, assisted living facilities, and halfway houses — residences for formerly institutionalized individuals (patients with mental disabilities, drug addicts or those formerly incarcerated) that are designed to facilitate their readjustment to private life. The term “residential buildings” does not include institutions, such as prisons, nursing homes, juvenile care facilities or hospitals, even though people may reside in these facilities for short or long periods of time.
- For this analysis, residential building heating fires are defined as those residential buildings (defined in endnote 3) for which the cause of the fire was determined to be heating. However, for the confined fire portion of residential building fires, only those with Incident Types 114 and 116 were included; all other confined fire types were excluded.
- USFA, “Fire in the United States 1983-1990,” Eighth Edition, October 1993.
- USFA, Fire Estimate Summary, “Residential Building Heating Fire Trends (2010-2019),” April 2021, https://www.usfa.fema.gov/downloads/pdf/ statistics/fire-estimate-summary-series.pdf.
- USFA, Topical Fire Report Series, “Residential Building Fires (2017-2019),” Volume 21, Issue 2, May 2021, https://www.usfa.fema.gov/downloads/ pdf/statistics/v21i2.pdf.
- Fire department participation in the NFIRS is voluntary; however, some states do require their departments to participate in the state system. Additionally, if a fire department is a recipient of a Fire Act Grant, participation is required. From 2017 to 2019, 68% of the NFPA’s annual average estimated 1,309,800 fires to which fire departments responded were captured in the NFIRS. Thus, the NFIRS is not representative of all fire incidents in the U.S. and is not a “complete” census of fire incidents. Although the NFIRS does not represent 100% of the incidents reported to fire departments each year, the enormous dataset exhibits stability from one year to the next without radical changes. Results based on the full dataset are generally similar to those based on part of the data.
- In the NFIRS, confined fires are defined by Incident Type Codes 113 to 118.
- The NFIRS distinguishes between “content” and “property” loss. Content loss includes losses to the contents of a structure due to damage by fire, smoke, water and overhaul. Property loss includes losses to the structure itself or to the property itself. Total loss is the sum of the content loss and the property loss. For confined fires, the expectation is that the fire did not spread beyond the container (or rubbish for Incident Type Code 118), and hence, there was no property damage (damage to the structure itself) from the flames. However, there could be property damage as a result of smoke, water and overhaul.
- USFA, Topical Fire Report Series, “Residential Building Fires (2017-2019),” Volume 21, Issue 2, May 2021, https://www.usfa.fema.gov/downloads/ pdf/statistics/v21i2.pdf.
- The average fire death and fire injury loss rates computed from the national estimates above do not agree with average fire death and fire injury loss rates computed from NFIRS data alone. The fire death rate computed from national estimates is (1,000 x 165/34,200) = 4.8 deaths per 1,000 residential building heating fires, and the fire injury rate is (1,000 x 600/34,200) = 17.5 injuries per 1,000 residential building heating fires.
- “One- and two-family residential buildings” include detached dwellings, manufactured homes, mobile homes not in transit and duplexes. “Multifamily residential buildings” include apartments, town houses, row houses, condominiums and other tenement properties. “Other residential buildings” include boarding/rooming houses, hotels/motels, residential board and care facilities, dormitory-type residences, sorority/ fraternity houses, and barracks.
- USFA, Topical Fire Report Series, “Residential Building Fires (2017-2019),” Volume 21, Issue 2, May 2021, https://www.usfa.fema.gov/downloads/ pdf/statistics/v21i2.pdf.
- USFA, Topical Fire Report Series, “One- and Two-Family Residential Building Fires (2017-2019),” Volume 21, Issue 6, July 2021, https://www.usfa. fema.gov/downloads/pdf/statistics/v21i6.pdf.
- USFA, Topical Fire Report Series, “Multifamily Residential Building Fires (2017-2019),” Volume 21, Issue 7, August 2021, https://www.usfa.fema. gov/downloads/pdf/statistics/v21i7.pdf.
- For this report, the time of the fire alarm is used as an approximation for the general time at which the fire started. However, in the NFIRS, it is the time at which the fire was reported to the fire department.
- As noted previously, confined building fires are small fire incidents that are limited in scope, are confined to noncombustible containers, rarely result in serious injury or large content loss, and are expected to have no significant accompanying property loss due to flame damage. In the NFIRS, confined fires are defined by Incident Type Codes 113 to 118.
- Total does not add up to 9% due to rounding.
- “Heaters” exclude catalytic heaters, oil-filled heaters and hot water heaters.
- A fire that is limited to a sofa or bed is not defined as a “confined fire” in the NFIRS because of the greater potential for spread. Unlike fires in pots or chimneys, there is no container to stop the fire, even though the fire did not spread beyond the object of origin.
- USFA, Topical Fire Report Series, “Residential Building Fires (2017-2019),” Volume 21, Issue 2, May 2021, https://www.usfa.fema.gov/downloads/pdf/statistics/v21i2.pdf.
- Total does not add up to 77% due to rounding.
- Total does not add up to 100% due to rounding.
- Total does not add up to 56% due to rounding.
- Total does not add up to 100% due to rounding.
- In confined fires, the entry “smoke alarm did not alert occupants” can mean no smoke alarm was present; the smoke alarm was present but did not operate; the smoke alarm was present and operated, but the occupant(s) was already aware of the fire; or there were no occupants present at the time of the fire.
- USFA, Topical Fire Report Series, “Residential Building Fires (2017-2019),” Volume 21, Issue 2, May 2021, https://www.usfa.fema.gov/downloads/pdf/statistics/v21i2.pdf.
- As confined fire codes are designed to capture fires contained to noncombustible containers, it is not recommended to code a fire incident as a small-, low- or no-loss confined fire incident if the AES operated and contained the fire as a result. The preferred method is to code the fire as a standard fire incident with fire spread confined to the object of origin and provide the relevant information on AES presence and operation.
- USFA, Topical Fire Report Series, “Residential Building Fires (2017-2019),” Volume 21, Issue 2, May 2021, https://www.usfa.fema.gov/downloads/pdf/statistics/v21i2.pdf.
- S. Department of Housing and Urban Development and U.S. Census Bureau, American Housing Survey for the United States: 2011, September 2013, “Health and Safety Characteristics-All Occupied Units,” Table S-01-AO, https://www.census.gov/content/dam/Census/library/publications/2013/demo/h150-11.pdf (accessed May 11, 2021).
- com staff, “Texas Grandmother, 3 Young Children Die In House Fire While Trying To Keep Warm During Outage,” dfw.cbslocal.com, Feb. 16, 2021, https://dfw.cbslocal.com/2021/02/16/3-young-texas-children-grandmother-die-house-fire-keep-warm-power-outage/ (accessed Aug. 17, 2021).
- Chavira, Danielle, “Fire In Fireplace Spreads Through Studs In Morrison Home,” denver.cbslocal.com, Feb. 15, 2021, https://denver.cbslocal.com/2021/02/15/fire-fireplace-studs-home-morrison/ (accessed Aug. 17, 2021).
- WLS, “Des Plaines fire: Space heater likely caused house fire that killed mother, 4 young girls, officials say,” www.msn.com, Jan. 29, 2021, https://www.msn.com/en-us/news/crime/des-plaines-fire-officials-say-space-heater-likely-caused-house-fire-that-killed-mother-4-young-girls/ar-BB1dbdlN (accessed Aug. 17, 2021).
- Heating is defined by the equipment used to heat a residential building. Incident Types 113, 115, 117 and 118 were excluded because, by definition, these incident types were not heating fires.
- The USFA Structure Fire Cause Methodology is designed for structure fires of which buildings are a subset. This methodology was used to determine heating as a cause of fires in residential buildings. The cause methodology and definitions can be found in the document “National Fire Incident Reporting System Version 5.0 Fire Data Analysis Guidelines and Issues,” July 2011, http://www.usfa.fema.gov/downloads/pdf/nfirs/nfirs_data_analysis_guidelines_issues.pdf.