
Because of the increasing urbanization – it is estimated that 70% of the world’s population will be living in cities in 2050 compared with 50% in 2010 – and the expansion of mega cities, the area available in the cities must be better utilized. As a result, the number of floors and the height of high-rise buildings will increase.
Definition of a High-rise Building
In Wikipedia, a tall, continuously habitable building of many storeys (at the end of the 19th century these were buildings with at least ten storeys) is called a high-rise building or skyscraper. Wikipedia Germany (www.wikipedia.de) defined (on 14.07.2021) a building, according to the state building codes, as a high-rise building “When the floor of at least one room is more than 22 metres above ground level. This is because fire brigade ladders can only rescue people from rooms that are 23 metres above ground level. For higher buildings, i.e. high-rise buildings, additional fire protection provisions have to be made, such as separate escape staircases. The requirements are specified in the High-Rise Directive.”
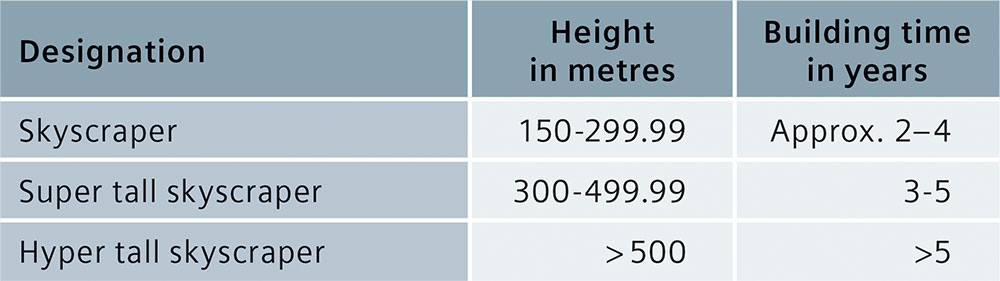
Recently there has been real race to erect the highest building. According to Wikipedia, a classification according to height has been introduced for clearer structuring (see Table 1).
Demands on Modern Planning
The demands placed on the power supply of a modern skyscraper are constantly increasing. A high level of safety, flexibility throughout the entire life cycle, a low level of environmental pollution, the integration of renewable energies and low costs are common demands nowadays that already have to be taken into consideration during the planning of a high-rise building. A special challenge is the coordination of the individual installations.
The main installations are, for example, heating, ventilation, air conditioning and refrigeration, fire protection, protection against burglary, building control system and power distribution. In modern planning, the demands on a high-rise building are not simply split up among the individual installations but have to be coordinated. An optimum solution is created from the networking of the individual requirements. This article is part of Siemen’s Application Models for the Power Distribution manual that provides an overview of the installations of a high-rise building that are important for the electrical power distribution and describes the basic and preliminary planning of the power distribution for an example. Chapter 3 specifically covers planning tasks when for energy management when erecting a skyscraper.
The planning requirements for an energy management system for the high-rise building are also integrated. Even if a building is used for 50 years or more, the significantly shorter cycles of changes in the usage, such as hotel refurbishment, new shop owners, new IT equipment in the computer centre and changes to the offices and in the life cycle of equipment and facilities require useful, long-term preliminary planning.
Planning Task when Erecting a Skyscraper
The greatest potential for the optimization of the power supply of a building is already clear during the planning phase. At this stage, the course is set for additional costs and cost increases which may incur during the erection and subsequent use of the building. Compared to conventional planning, integrated planning continually improves the cost-benefit ratio. When tackling complex tasks, integrated planning takes the synergies of coordinated, intelligent, integrated systems and products from a single supplier into account and implements them in cost-effective solutions. Interfacing and elaborate harmonization of different systems and products of different manufacturers becomes obsolete.
3.1 Preliminary Planning
Because of the numerous options for utilizing, arranging and styling the rooms and floors of a high-rise building, there are always specific requirements for the planning of the electric power distribution. When compiling the boundary conditions, the following must be taken into account during the preliminary planning of the high-rise building:
- Type, utilization and shape of the parts of the building (differentiation of the supply areas)
- Regulations and requirements of the building authorities (e.g. in Germany the Model High-Rise Directive – MHRD)
- The technical building equipment required for operation
- Requirements of the distribution system operator, such as the technical supply conditions
- Power demand application, tariffs, connection costs
- Possibilities of distributed power generation, own utilization, energy storage and system feed-in
- Determination of the building-related connection values depending on the supply area loads that correspond to the building’s type of use
- Determination of the load centres in order to specify the transformer arrangement and the associated low-voltage main distribution system
When planning a high-rise building the optimal solution is always sought , which should be checked with regard to usefulness and cost-effectiveness taking the following conditions into account:
- Compliance with the regulations for erecting electrical systems (IEC 60364 and IEC 61936 resp. VDE 0100 and VDE 0101), stipulated guidelines and regulations (e.g. safety of persons in the German accident prevention rule DGUV 3), as well as project-related regulations for special systems.
- Clarity of the network topology
- Cost-effectiveness through the medium voltage distribution through to the load centres and optimized rating of the planned equipment according to operating current and fault current carrying capacity
- Supply and operational safety through redundancy, selectivity, short-circuit strength, overvoltage protection, fault current carrying capacity and a high degree of availability of the equipment
- Supply quality, system perturbations and electromagnetic computability
- Minimization of the adverse environmental effects during creation and operation
- Flexibility to power changes through simple adaptation options
- Ease of maintenance through the use of uniform components
- Optimization with regard to voltage drop and transmission capability
- Ambient conditions such as installation altitude, humidity, ambient temperature, required fire protection and spatial boundary conditions
In accordance with these points, the following dimensioning criteria must be taken into account when planning the power supply:
- Determination of the network load (connection value)
- Simultaneity factors
- Utilization factors
- Specific area load for estimated power factor
- Power system configuration taking into account
- Structure of the supply area and purpose
- Number, size and position of the load centres
- Transformer arrangement options and the associated low-voltage main distribution system (transmission losses, voltage drop)
- Routing
- Low-voltage (mostly distributed) or medium-voltage (mostly central) emergency power supply
- Rating and selection of
- Electrical equipment
- Switchgear
- Distribution transformers
- Conductor cross sections (for cable and busbar trunking systems)
- System protection
3.2 Preliminary Planning of the Energy Management System
An energy management system (EnMS) is used for the systematic acquisition of the energy flows and facilitates investment decisions to improve the use of energy. Appropriate planning of the measuring and evaluation equipment creates the prerequisites for this. Proof of the continual improvement of the output-related energy utilization can also be provided and the legal requirements taken into account. Important goals of the improvement measures can be:
- Cost reduction
- Sustainable management
- Environmental protection
- Time and resource optimization
- Improvement of image and social acceptance
- Legislative and tax relief
To achieve these goals, the holistic approach of the EnMS from the planning, through the construction, use and renovation to the dismantling must be taken into account.
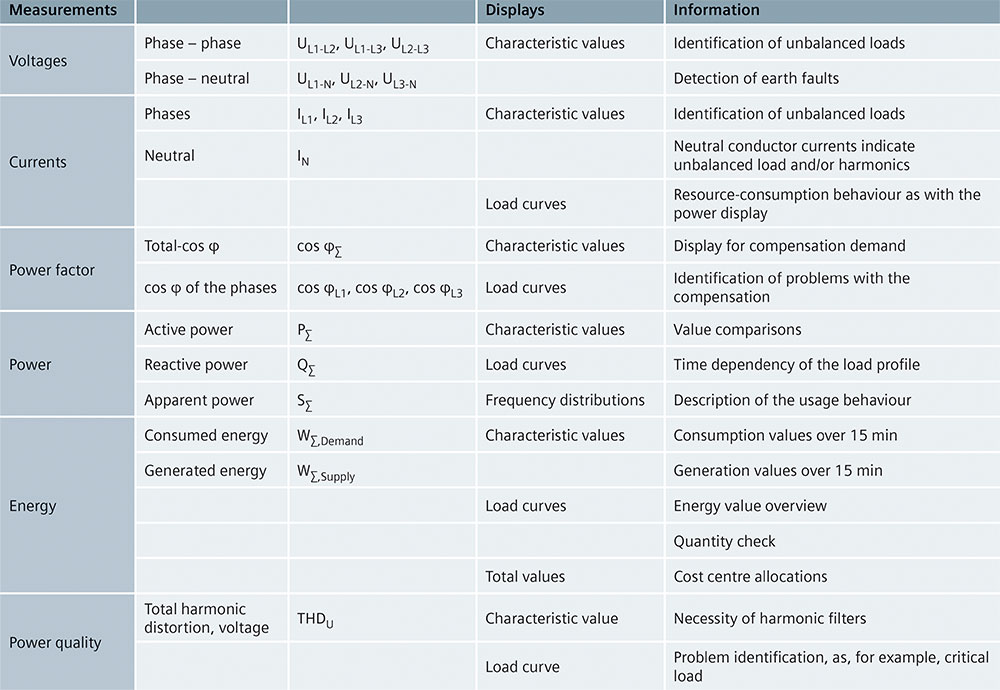
In accordance with the schematic diagram in Figure 1, appropriate measurements should be incorporated in the preliminary planning. According to the white paper “Applications for Power Distribution – Energy Transparency” (Siemens AG, 2017), the measurements and displays described in form the basis for an energy management system.
![Figure 1. [Chapter 2 Fig 2/2] Recommended measurements for managing a high-rise building](https://iaeimagazine.org/wp-content/uploads/2021/08/2021_09_Siemens_FIG1.jpg)
Load management and energy schedule
The power and energy demand is greatly influenced by the varied applications in the high-rise building and the numerous variables. The prerequisites for a load management and the creation of energy schedules based on this should be established during the planning. The load management can be used to limit the maximum power consumption to a settable value, in order to maintain the agreements made with a distribution system operator.
Consumers that can be specifically switched on and off should already be identified during the initial planning phases. In addition, the networking of the energy distribution, automation and IT should be planned for the load management so that the operational processes in the various parts of the high-rise building can be clearly displayed. Otherwise, the planned maximum power demand must be selected much too high, especially with mixed usage.
As the electricity price is made up of a kilowatt-hour rate and a demand charge, load and forecast management should be taken into account when planning the associate measuring and evaluation equipment so that a demand-optimized energy schedule can always be created. In the future, supply contracts and mandatory compliance with schedules will play an increasingly important role in the cost optimization. When completing such contracts, the customers will have to specify their electricity demands in quarter of an hour intervals for one week in advance. Based on these values, the electricity trader purchases the electricity and demands an agreed price. If the actual demand is less than the forecast demand, this will not be credited. The agreed price will therefore be paid for a greater amount of electricity than that actually used. If more electricity is required than forecast, this results in additional costs which are based on the price for ancillary services at the time of demand.
If the supply contract contains a schedule clause, a forecast management should monitor the schedule. If the demand is greater than forecast, consumers are switched off and with demand lower than forecast, consumers are switched on. Consumers must be defined that can be specifically switched on and off for this purpose.
3.3 Boundary Data for the Design Example
It is not possible to define a standard high-rise building. Ambient/environmental conditions, official regulations, building use, operator wishes and specifications for equipment, schedule and costs require building-specific planning. For this reason, the following specifications have been selected as an example for a super tall skyscraper.
The super tall skyscraper is to be planned for mixed use and with a total of 80 floors. It is to have 75 floors above ground level and five below. With a floor height of four or five metres, this will result in an overall height of over 300 metres above ground level. The building narrows towards the top for architectural reasons, user-friendly room and window areas as well as to reduce the wind load and turbulence at great heights (Fig. 3/1).
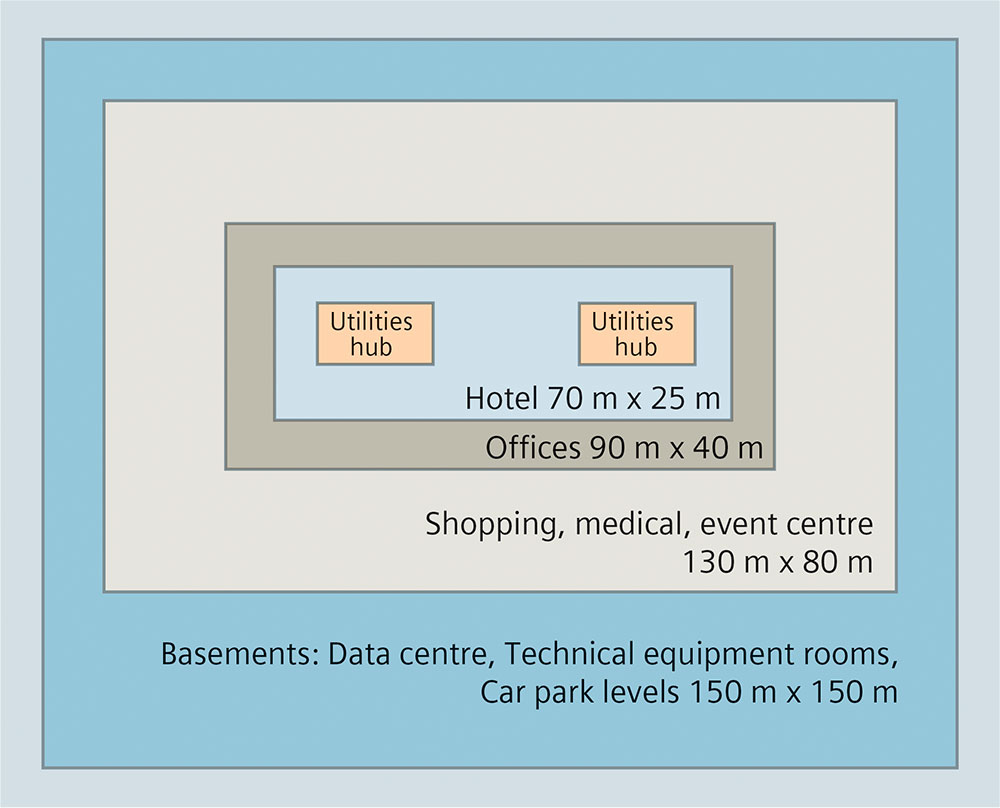
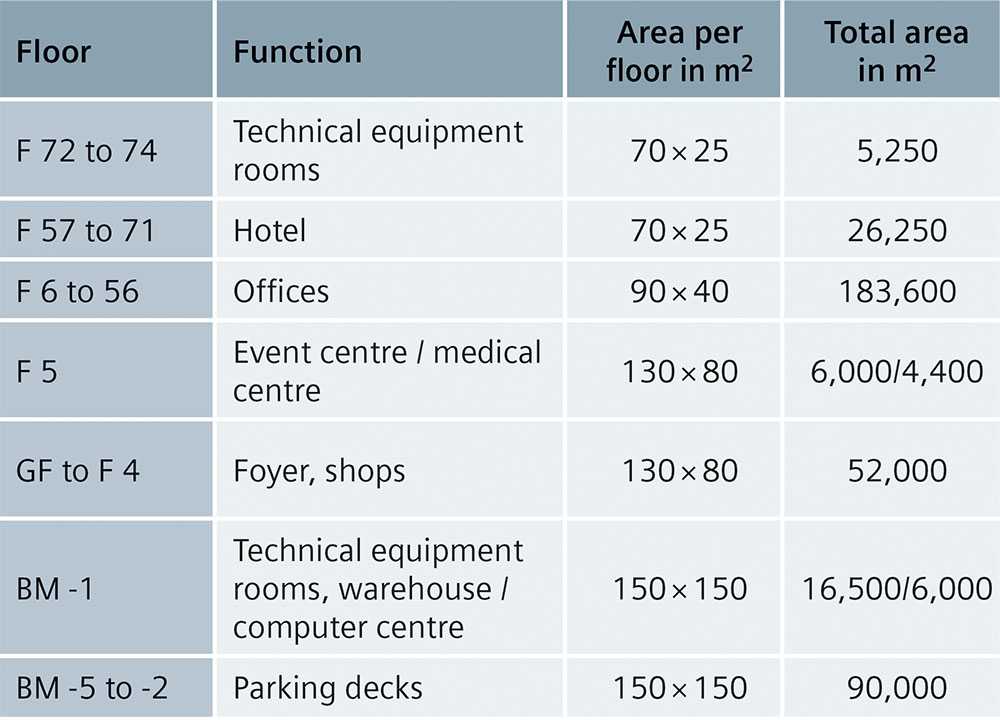
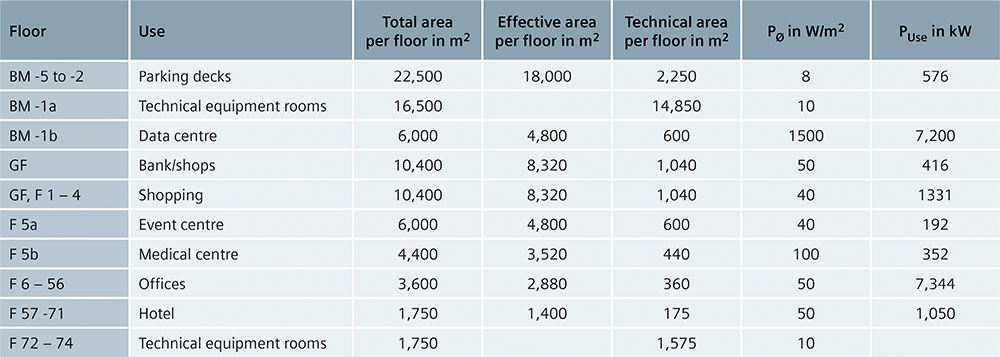
The vertical distribution of the building use with the associated areas is specified in Tab. 3/2. This distribution is shown schematically in Fig. 3/2, whereby the various types of lifts required for a high-rise building are displayed in colour. Instead of considering each single floor, which would be necessary to assign the technical equipment and lifts or escalators in detail, the technical equipment areas and the walls refer to the floor area. 10 % are subtracted from the floor area for staircases, walls and corridors and 10 % for technical equipment areas and lifts for the effective area on each floor.
3.4 Determination of the Power Demand
The planner is already expected to provide advice on the total power demand during the Phase 1 for planning the power supply of a building, where basic data is established. An estimate based on the effective area under consideration of the workmanship is sufficient. The planner’s design experience and information on the customer’s ideas with regard to the workmanship are required to obtain realistic data. These can then be used immediately as boundary conditions for an initial cost estimate.
In the Phase 2 of the preliminary planning, a planning concept should be created with rough dimensioning of the important systems. Different variants should be considered with regard to cost-effectiveness, environmental compatibility and sustainability.
3.4.1 Estimate of Power Demand
Characterisation according to room structure, comfort and air conditioning can be used for a rough estimate of the power demand. At the same time, further factors play an important role in the estimate such as the expense of the technical installations and the integration in a building management system. Whereby, it is not always the case that a sophisticated technical solution is combined with a high-quality building management system.
The experience that we have gathered in numerous projects forms the basis for the initial, simplified calculation. A value of approx. 60 to 150 W/m² in relation to the effective area of the building is used to estimate the power demand (power to be supplied) of a high-rise building. Because of the wide range, it must be estimated for the planning of the building whether the figure will be closer to 60 W/m² or 150 W/m². For this purpose, we provide an estimation procedure with various calibration factors in the following as a simple help. A similar procedure is also used in EN 15232. Efficiency factors are used in this procedure that quantify the classification of the technical building characteristics and the use of systems for the building automation (BA) and the technical building management (TBM).
These factors (Tab. 3/3) are calibrated later for our estimation procedure on a value range between 0 and 1 and for a characterisation of BA/TBM and the technical building characteristics. Numerous addition factors influence the power demand and we want to use some for our simple calculation model. We will restrict ourselves to six characterization features that are applied equally:
- Building placement
- Room structure
- Level of comfort
- Air conditioning option
- Technical characteristics
- BA/TBM
Of course, you can also use your own factors as additional boundary conditions. The planner and the client should always agree on these factors to ensure the traceability of the calculation. Six calibration factors corresponding to the six characterisation features identify the power demand of the building in the model.
- Calibration factor kplc for the building placement
- Calibration factor kstruct for the room structure
- Calibration factor kcomf for the level of comfort
- Calibration factor kclim for the air conditioning options
- Calibration factor ktech for the technical characteristics
- Calibration factor kBA/TBM for the BA/TBM
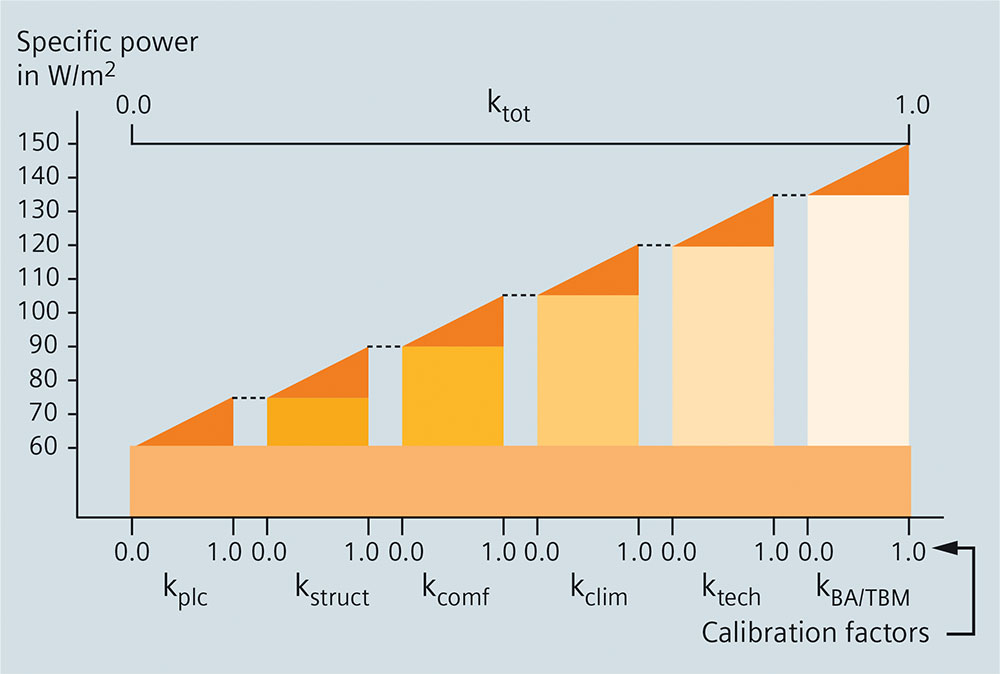
As we do not want to apply any further weighting to the factors, the mean value of the calibration factors can be defined as the total value:
To determine the specific power demand, we will start with the lowest expected value (here: 60 W/m²) and determine a factor ktot from our estimations of the six subfactors. This factor is used to weight the difference (90 W/m²) to the upper expected factor 150 W/m² and added to the basic value of 60 W/m². First of all a characterisation of the individual calibration factors and the specification of the values are required for the estimation (Fig. 3/3).
Placement of the building – calibration factor kplc
The location of the building has a fundamental influence on the planning of the power supply. The following questions can also be used to obtain an estimation:
- Do special conditions with regard to adjacent buildings have to be considered?
- Which traffic routes and connections can be used?
- What type of power supply is possible? And to what degree?
- Are there legal boundary conditions that have to be taken into consideration?
As the super tall skyscraper in the example is to be considered with special local conditions, the placement factor kplc = 0.5 is set.
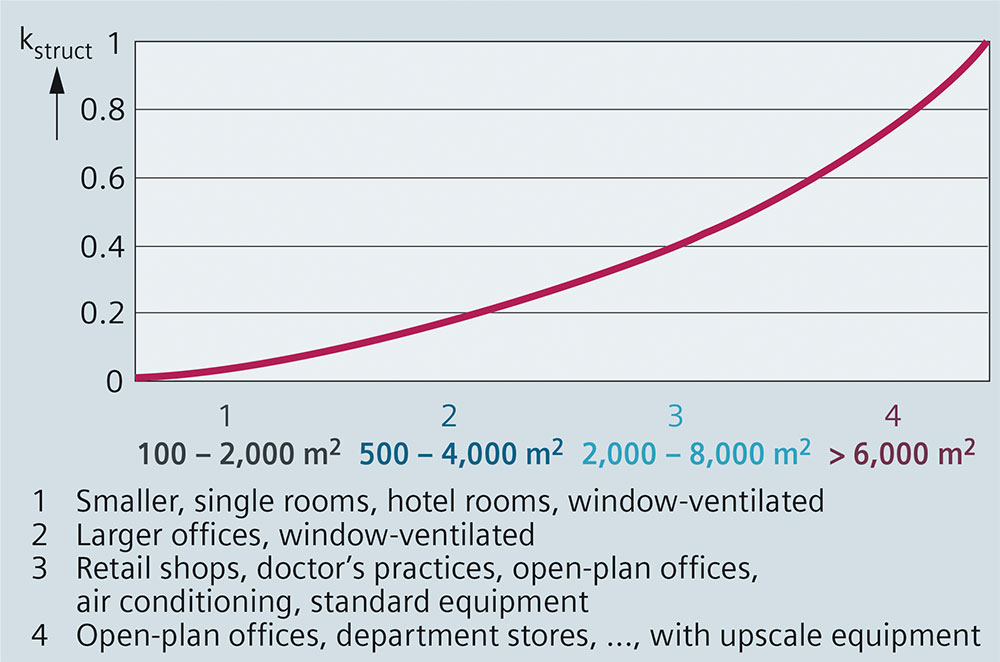
Room structure – calibration factor kstruct
Smaller rooms are easier to ventilate and the lighting is distributed better in the room through reflection on the walls and ceiling. This calibration factor can also take the intended room height into account. Our estimations that are displayed in Fig. 3/4 as a curve also take into account that small rooms and areas frequently have direct ventilation and not air conditioning. Larger rooms and halls generally have a larger calibration factor kstruct. At this point, we would again like to emphasise that the experience and project knowledge of the planner and the agreement with the client are decisive when determining the factors. You can also talk about your specific projects with the Siemens promoters for TIP.
The use of a large number of floors for small hotel rooms and offices results in a favourable factor kstruct of 0.3 in relation to the floor area for the model of the super tall skyscraper.
Comfort and safety equipment – calibration factor kcomf
It is difficult to make general statements about comfort as it is largely dependent on how the building is used. Whereas good lighting, an audio system and a monitoring system are considered as standard in a shopping centre, these characteristics may be considered as comfort features in office areas. On the other hand, blinds play no role in shop windows, but are important in hotels and offices. High-speed lifts for large loads require more power, as well as special stagecraft technology and technically sophisticated, medical diagnostic equipment. Control and monitoring systems make buildings safe and user-friendly. We will therefore select a factor kcomf = 0.5 for our model.
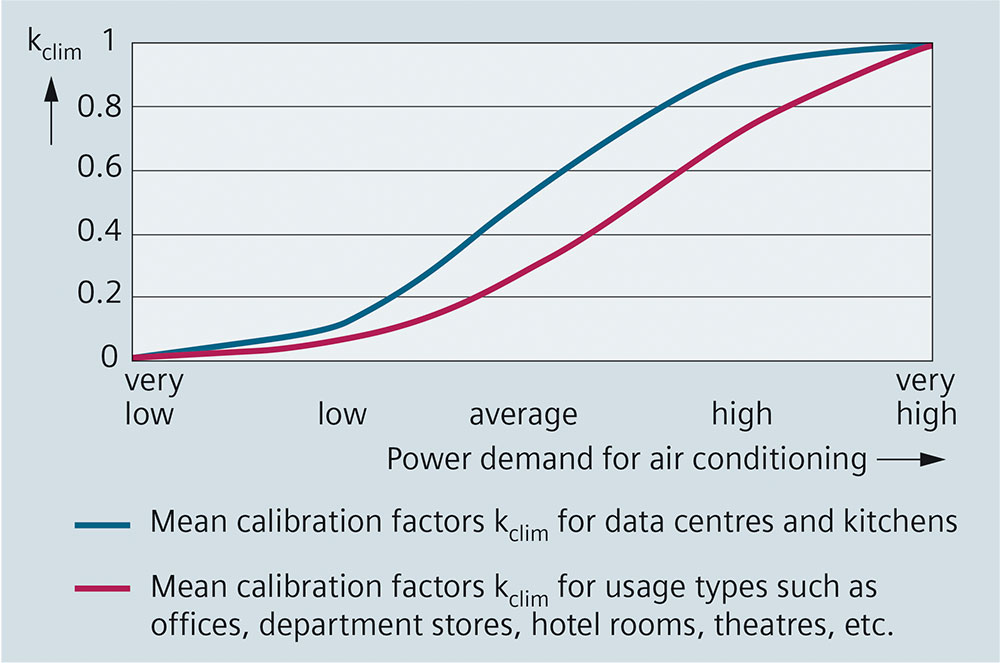
Air conditioning – calibration factor kclim
With regard to the air conditioning of a building, natural ventilation, the efficiency of the cooling equipment and the possibilities of reducing the solar radiation without impairing the light conditions in the rooms must be taken into account. In Germany, the Association of German Engineers (VDI) have considered the building-specific power demands of the air ventilation and cooling in guideline VDI 3807-4.
We have displayed the calibration factors in a curve for the data described therein for the specific power installed in offices, hotel rooms, kitchens, computer centres, theatres, department stores, multi-storey car parks, etc. for the various demand classes from “very high” to “very low”. Computer rooms that are better planned without windows, generally require more expensive air conditioning – constant temperature and humidity – although there is little effect from solar radiation. It should also be noted that the air conditioning depends on the room structure and the comfort requirements. For the example of a super tall skyscraper with mixed use, we assume a factor of kclim = 0.4 because this takes into account the good use of natural cooling options and also the increased expense for the air conditioning of the computer centre (Fig. 3/5). The superimposition of lots of individual curves has shown that only types of use with a high demand for cooling, such as computer centres and kitchens, display a slightly different curve shape.
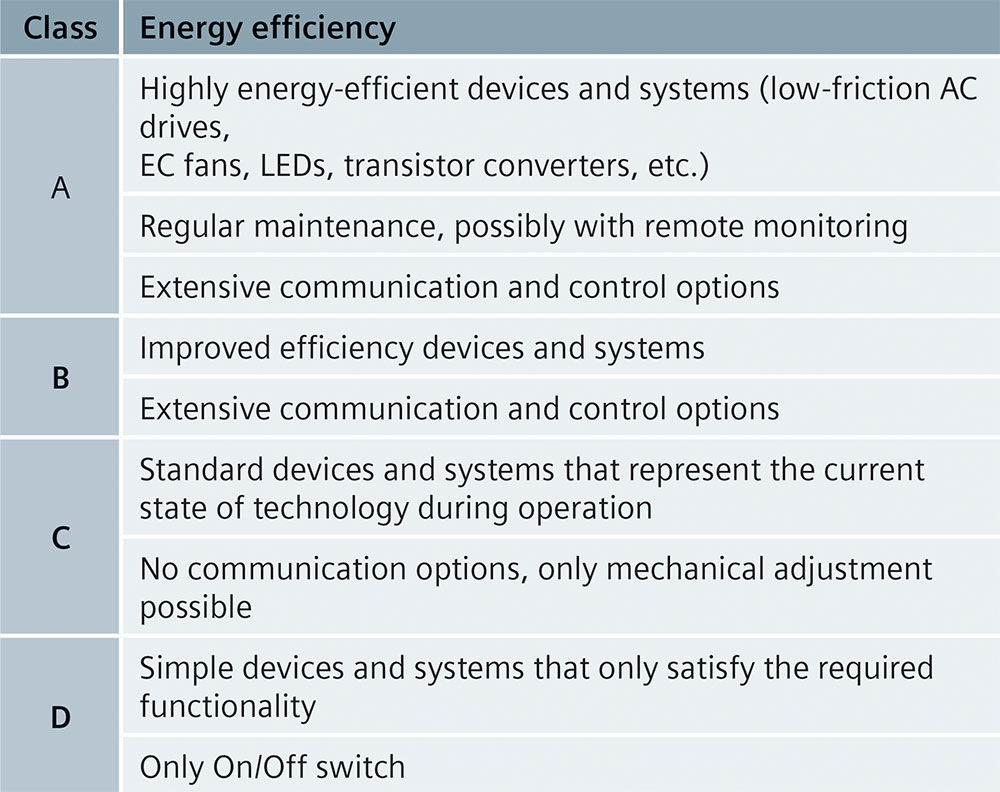
Technical characteristics – calibration factor ktech
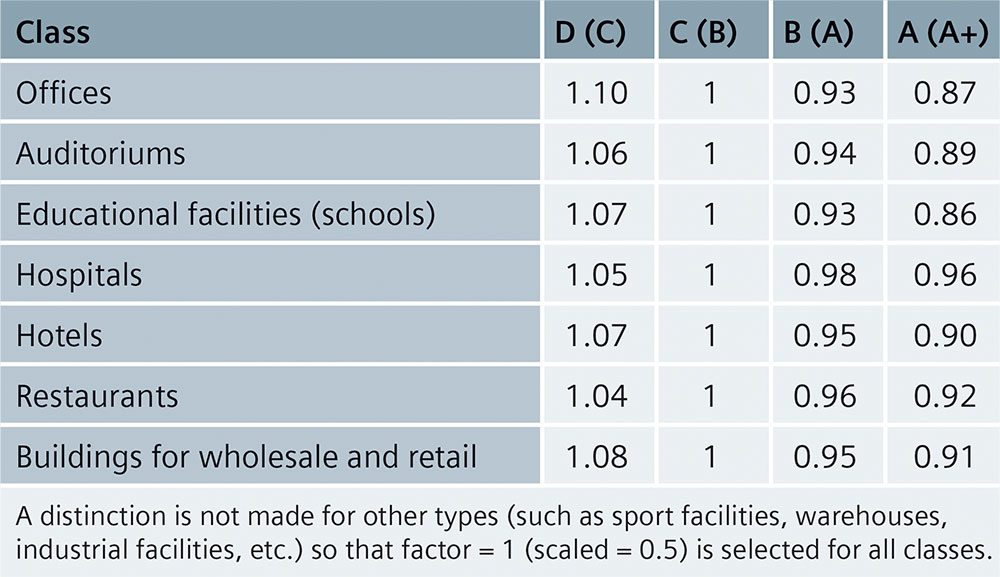
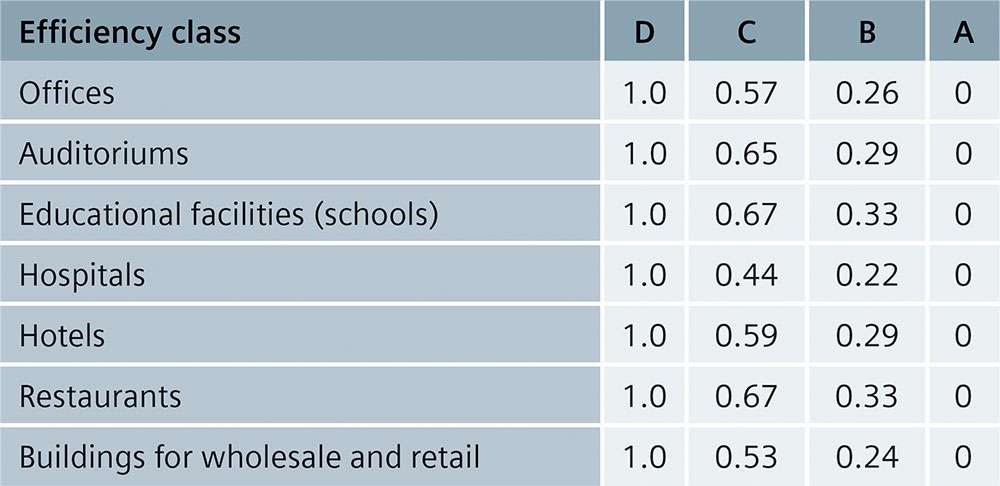
Even when the functionality of the technical building equipment has been defined, the difference in the technical versions is significant. High-speed lifts required higher starting currents than slower lifts, fans with EC motors (electronically controlled) save power and modern light fittings reduce the power demand, and the efficiency of many electrical consumers differ greatly from version to version. A general classification for the energy efficiency according to standard EN 15232 is listed in Tab. 3/4.
The efficiency factors of EN 15232 from Tab. 3/3 are transformed in Tab. 3/5 to the desired calibration area between 0 and 1.
A distinction is not made for other types (such as sport facilities, warehouses, industrial facilities, etc.) so that factor of 0.5 is selected for all classes.
For the high-rise building model, we assume large technical expenses averaged over the areas of the building, corresponding to class B and therefore high efficiency, so that we select ktech = 0.3.
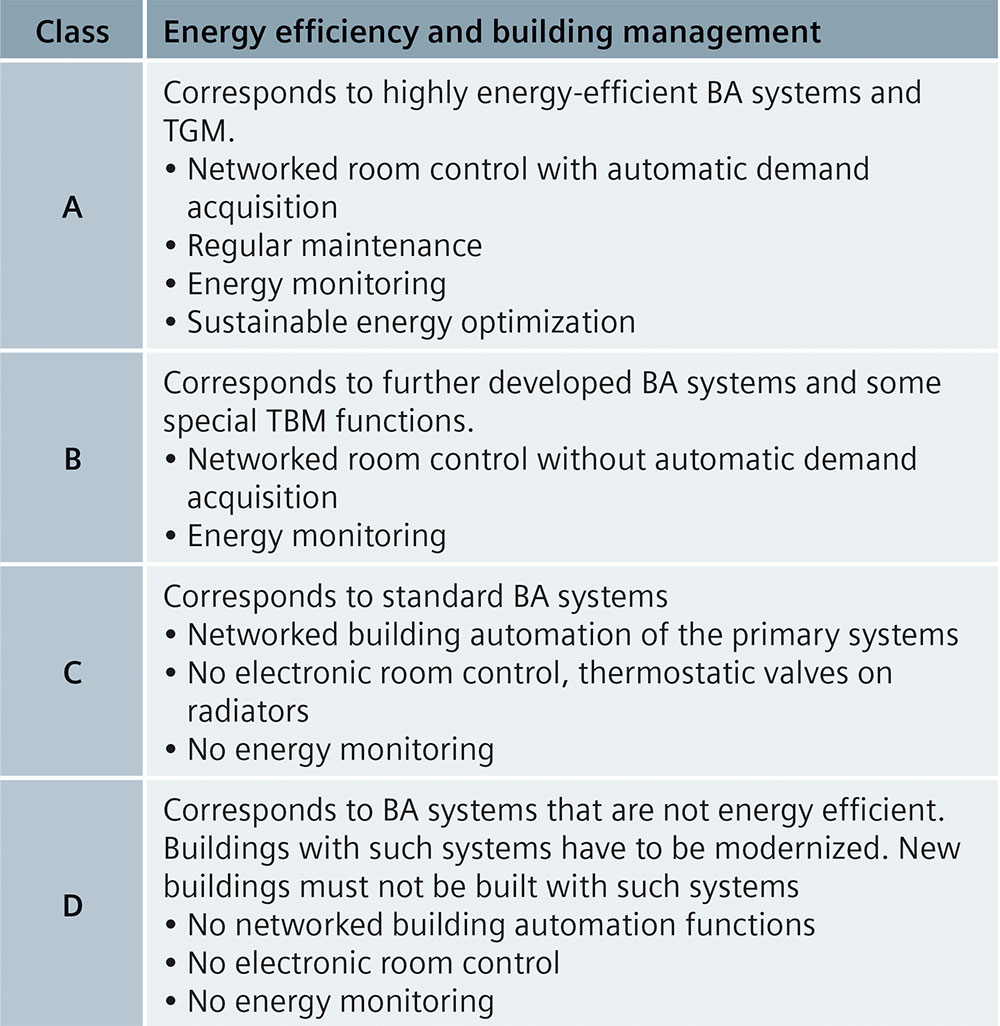
Building management – calibration factor kBA/TBM
In the same way as for the technical characteristics, standard EN 15232 (Tab. 3/6) can be used for the building management.
However, note that energy efficiency class D from EN 15232 plays no role for the planning of BA/TBM systems of new buildings. The advantage of our procedure with scaled calibration factors is displayed here. Characterisation features can be adapted to the latest technology through the scaling and the classification always defined through the own current experience.
We will therefore omit class D and select a new class A+, which in addition to the properties of class A, is characterized by remote monitoring, remote diagnostics and remote control as well as analysis tools for BA/TBM, as part of Smart Grid. For the four new classes C, B, A and A+, we will then take over the appropriate calibration factors according to Tab. 3/5. Averaged across the various types of use in the building, we will select a high efficiency together with large expense for control, management and automation through a further-developed BA system. The factor kBA/TBM = 0.3 will the be assumed for our high-rise building model.
This results in
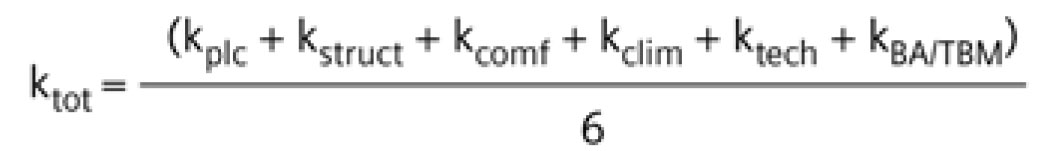
and therefore a specific power demand of
Pspec = 60 W/m² + (90 W/m² ⋅ 0.383) = 94.5 W/m².
A total area of 390,000 m² is calculated from Tab. 3/2. The total area of the building is multiplied by a factor of 0.8 for an approximation of the effective area.
Effective area = 390,000 m² ⋅ 0.8 = 312,000 m²
The product from effective area and specific power demand results in an estimated power demand of 29.5 MW for the entire building.
3.4.2 Estimated Determination of the Power Demand
Through the precise consideration of the type of building use, the building equipment and the associated network topology, the power demand can be estimated as described in the Siemens TIP planning manuals.
With the distribution of the use and areas from Tab. 3/2 and Tab. 3/7 this results in the following for the individual floor areas:
– Basements –5 to –2:
Effective area = 0.8 ⋅ floor area = 18,000 m²
Average power demand (multi-storey car park) = 8 W/m²
Power demand for each floor = 144 kW
–Basement 1:
Area distribution: 6,000 m² computer centre / 16,500 m² technical equipment area
Effective computer centre area = 0.8 ⋅ 6,000 m² = 4,800 m²
Effective technical equipment area = 0.9 ⋅ 16,500 m² = 14,850 m²
Average power demand (computer centre) = 1,500 W/m²
Power demand share for computer centre = 7,200 kW
– Ground floor
Effective area = 0.8 ⋅ floor area = 8,320 m²
Average power demand (shopping centre / bank) = 50 W/m²
(additional larger room height)
Power demand for ground floor = 416 kW
– Upper floor 1, 2, 3, 4:
Effective area = 0.8 ⋅ floor area = 8,320 m²
Average power demand
(shopping centre) = 40 W/m²
Power demand for each floor = approx. 333 kW
– Upper floor 5:
Area distribution: 6,000 m² event centre / 4,400 m² medical centre
Effective event centre area = 0.8 ⋅ 6,000 m² = 4,800 m²
Effective medical centre area = 0.8 ⋅ 4,400 m2 = 3,520 m²
Average power demand
(event centre) = 40 W/m²
Average power demand
(medical centre) = 100 W/m²
Power demand share for event centre = 192 kW
Power demand share for medical centre = 352 kW
– Upper floors 6 to 56:
Effective area = 0.8 ⋅ floor area = 2,880 m²
Average power demand (offices) = 50 W/m²
Power demand for each floor = 144 kW
– Upper floors 57 to 71:
Effective area = 0.8 ⋅ floor area = 1,440 m²
Average power demand (hotel) = 50 W/m²
Power demand for each floor = 70 kW
Refrigeration/ventilation
An average power demand of 50 W/m² can be assumed for cooling and ventilation of the effective area above ground. The air conditioning requirement for the computer centre has already been included in the average power demand, as this is a major criterion for the energy efficiency of a computer centre.
For the effective area above ground of 217,800 m², the power demand for ventilation and refrigeration is 10.89 MW.
Distribution of the power demand of the computer centre
For a computer centre with an efficient infrastructure, 75 % of the required electricity is used for the supply of the ICT equipment (ICT = information and communication technology; i.e. servers, routers, switches, data storage, etc.) and 25 % for the supply of the infrastructure (air conditioning units, ventilation, uninterruptible power supply, lighting, monitoring, etc.). The PUE factor (PUE = Power Usage Efficiency) known in the IT sector mirrors the relationship between the total power demand and the power demand for the ICT equipment (here 5,400 kW). With the assumptions made earlier, this results in a PUE value of 1.33. This results in a power demand of 1,800 kW for the cooling and ventilation of the server rooms in the computer centre.
Technical equipment areas
An average power demand of 10 W/m2 is assumed uniformly for the technical equipment rooms on the individual floors, which is multiplied by the total technical equipment area and used to determine the power demand. A lower ventilation and air conditioning power demand is taken into account for these areas.
The technical equipment areas for each floor from Tab. 3/8 add up to 56,400 m² for the whole building resulting in:
Power demand for the technical equipment areas of the building
= 56,400 m² • 10 W/m²
= approx. 560 kW
From the sum of the total power demand for the effective areas from Tab. 3/8 for the technical equipment areas and for the air conditioning of the building areas above ground, this results in a total power demand of approx. 29.9 MW.
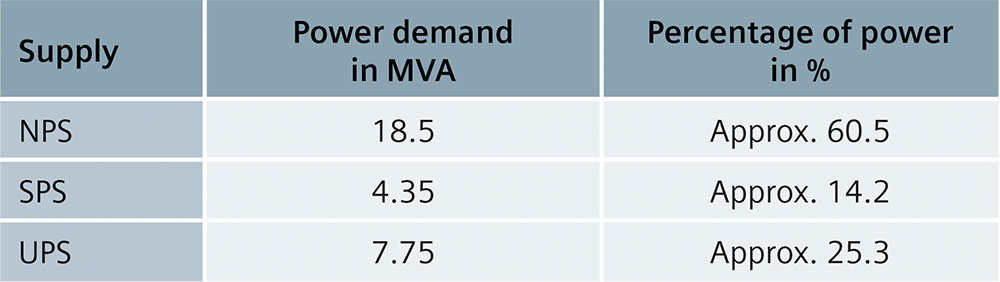
3.4.3 Distribution According to Supply Types
The required transformer output and the shares of the safety power supply and the UPS are now determined for the values for the total power demand found in section 3.4.1 and 3.4.2.
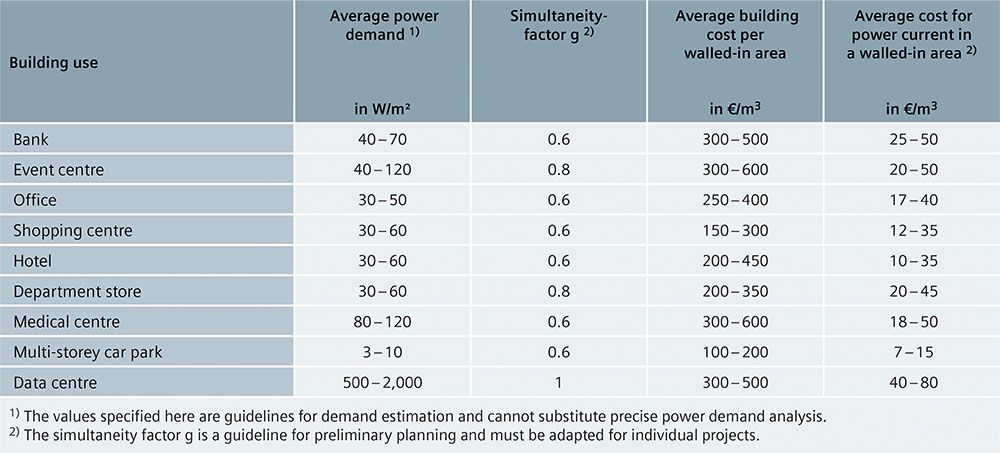
The application-specific outputs are multiplied by the simultaneity factors from the data from Tab. 3/7 and added up for the total required power.
Total power demand =
= (4 ⋅ 144 kW) ⋅ 0.6 (multi-storey car park)
+ 416 kW ⋅ 0.6 (bank / shopping centre)
+ 4 ⋅ 333 kW ⋅ 0.8 (department store)
+ 192 kW ⋅ 0.8 (event centre)
+ 352 kW ⋅ 0.6 (medical centre)
+ 7,200 kW ⋅ 1.0 (computer centre)
+ 51 ⋅ 144 kW ⋅ 0.6 (offices)
+ 15 ⋅ 70 kW ⋅ 0.6 (hotel)
+ 560 kW ⋅ 0.3 (technical equipment)
+ 10.89 MW ⋅ 0.7 = (refrigeration, ventilation)
= 22.05 MW
If cos φ is specified as 0.9 and the transformer degree of utilization as 80%, a total transformer output = 22.05 MW / (0.9 ⋅ 0.8) = 30.6 MVA is required.
The dimensioning of the safety power supply (SPS) depends mainly on the building utilization and on average is approx. 20 to 30 % of the power required for the normal power supply (NPS). However, this value must be determined project specifically and is only an estimation of the connected applications here: In this example, the computer centre in the high-rise building requires a large share of the SPS for the UPS systems. The following must be taken into account for the SPS:
- Emergency lighting (approx. 3 to 10 % of the illuminance of the normal lighting, depending on the safety classification of the valid safety regulations; the following is required in the workplace regulation in Germany: E = 0.1 ⋅ En [En = rated illuminance]; however at least 15 lux)
- Supply of the fire control centre / smoke vents / sprinkler system / smoke extraction system
- Evacuation lifts, lifts for the fire brigade
- Maintenance or controlled shutdown of processes (this is usually an extra requirement from the user in order to reduce downtimes; there are no general statutory regulations for interruptions in the work process)
- Control and protection systems that must be maintained in an emergency
- Supply of life-supporting systems (e.g. in a clinic: generally an additional power supply, APS, is required here that can ensure an uninterruptible power supply in accordance with IEC 60364-7-710 (VDE 0100-710) through battery backup)
UPS systems are generally used to maintain operation in a computer centre and the ICT equipment of various applications. They take over the power supply of critical consumers with switching interruptions and start-up mode. Air conditioning and ventilation equipment may belong to the critical consumers in the computer centre if heat problems occur in the server racks when these components fail for just a few seconds.
- Taking into account power redundancy, cos φ = 0.9 and a reserve power of 20 %, various UPS systems with different outputs and different UPS types can be considered for the ICT equipment in the computer centre:
- Static UPS comprising: Rectifier/inverter unit and battery or flywheel energy storage to bridge a power failure – for long-term supply when the NPS fails, the UPS systems are supplied via generators of the SPS.
- Rotating UPS comprising: Motor/generator set and flywheel energy storage or rectifier/inverter unit with battery to bridge a power failure
Without taking a redundancy concept into account, UPS systems with a total rated output of 7,500 kVA must be installed for the computer centre, and an additional UPS output of approx. 250 kVA for the control centre, safety systems and lighting.
Suitable rooms should also be provided for further UPS systems in all other areas of the high-rise building. Depending on the application sizes and the technical characteristics, the percentage of the UPS in relation to the NPS can differ greatly. The specifications can only serve as a guide:
- For the payment, access, guidance and safety systems in the car park (5 to 10 % UPS)
- For the payment, communication and safety systems in the shops (2 to 5 %)
- For the counter, communication and safety systems in the bank (3 to 10 %)
- For the ticket, media, guidance and safety systems in the event centre (2 to 10 %)
- For the office, communication, safety, diagnostic and treatment systems in the medical centre (2 to 20 %)
- For the data processing, communication and safety systems in the offices (2 to 10 %)
- For the hotel administration, communication, access and safety systems in the hotel (2 to 5 %)
- From the previously determined values for the power demand, this results in a UPS demand of approx. 250 kVA, which can be covered by smaller, distributed UPS systems, that can be supplied via the NPS and SPS of the floor distribution systems. The power distribution for our example is shown in Tab. 3/9.
3.5 Use of Photovoltaic Systems
Particularly on the upper floors, the façade of a high-rise building provides a suitable surface for the energy use of photovoltaic (PV) systems. The photovoltaic modules can also be used to protect the façade, for soundproofing, thermal insulation and can be incorporated in the façade design. The additional benefits can be evaluated in monetary terms and set against the costs of the photovoltaic system.
In addition to the geographic location of the building, the alignment of the façade and the angle of inclination to the horizontal influence the amount of energy produced by the photovoltaic system. Compared to an optimal angle of inclination for Central Europe of 35 ° to the horizontal, a vertical arrangement of the photovoltaic modules reduces the annual amount of energy produced with a southerly alignment by approx. 25 to 35 %. However, a vertical arrangement has advantages with regard to the soiling of the module surfaces.
The photovoltaic system has no effect when determining the power as a maximum power demand without photovoltaic supply must be assumed. In standard IEC 60364-7-712 (VDE 0100-712) for setting up low-voltage systems, “Part 7-712: Requirements for special installations or locations – Solar photovoltaic (PV) power supply systems”, it is explicitly stated that when selecting and setting up facilities for disconnection and switching, the public power supply must be considered as power source and the PV system as load.
In such on-grid systems that supply electrical energy in parallel to public electricity supply systems, the DC voltage produced by the PV modules is converted to AC voltage by an inverter. Since the start of 2012, new requirements for Germany are described in the VDE code of practice VDE-AR-N 4105 for a PV system greater than 13.8 kVA that can be summarised as follows:
- Frequency-dependent active power reduction between 50.2 and 51.5 Hz from 100 % to 48 % (this function is already integrated in the solar inverter SINVERT PVM1)
- Reactive power control to a cos φ value between cos φ ind = 0.9 and cos φ cap = 0.9 – the characteristic curve has already been implemented for devices of the SINVERT PVM type
- Power supply and system protection to monitor the supply voltage and frequency as well as a bus coupler circuit breaker – PV systems up to 30 kVA can be isolated by the bus coupler circuit breaker integrated in SINVERT PVM; up to 100 kVA, SIRIUS 3RT contactors in type-tested combination with fuses of the SENTRON 3NA and 5SE product families can be used for a central, redundantly set up bus coupler circuit breaker; above 100 kVA, the SENTRON 3VA moulded-case circuit breakers and moulded-case line disconnector switches with motor drive and the appropriate auxiliary release can be used as bus coupler circuit breaker
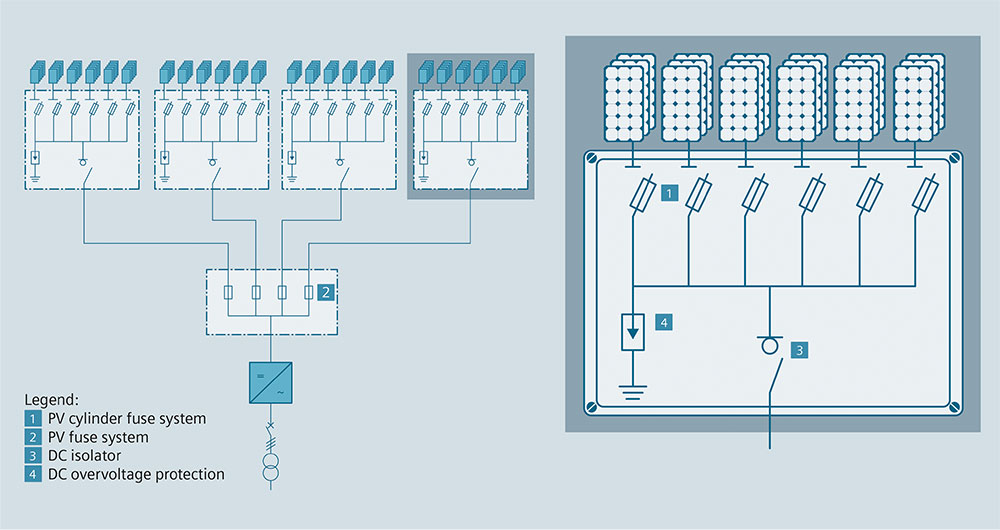
- Central PV system – on the DC side the electrical energy of the PV modules is brought together in so-called string boxes and led to a central inverter via the generator connection box (Fig. 3/6). A DC voltage of up to 1,000 V on the DC side places special demands on the protective components (see chapter 5 for suitable products).
Advantage: Only one installation site or utilities room with good accessibility required; easy to maintain
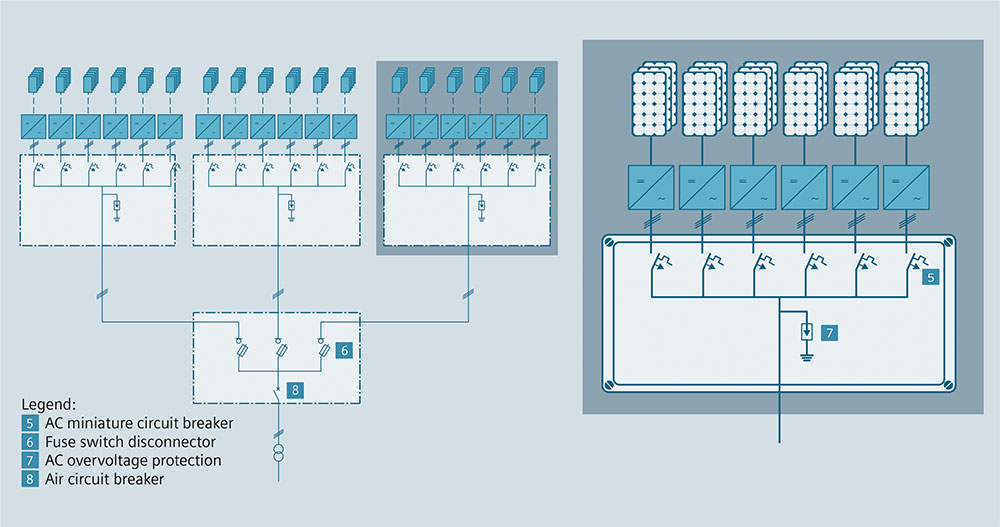
Disadvantage: DC system required - Distributed PV system – the modular structure with inverters that are assigned to the respective PV modules can be used flexibly. Several strings of a module are led directly to an inverter and the AC side of several inverters is collected in the so-called AC collection boxes (see Fig. 3/7) and fed into the low-voltage system. A protection concept must be provided here for the AC side (see suitable products in chapter 5 in the original white paper).
Reprinted with permission by Siemens. “Application Models for the Power Distribution of High-rise Buildings.” Paper available on website at www.siemens.com/tip-cs.