
One of the main challenges while performing power studies on commercial buildings is getting the right data. Different measures and electrical codes are used to determine the suitable accuracy level in a specific case. When it comes to the data collection step, a level of approximation might be a necessary step to be able to complete a certain study. Collecting site data is not limited to nameplates data, but also equipment state and calibration history. This paper presents some of the faced challenges when building a system for a power study. Accurate models not only ensure keeping the site safely operating, but also contributes towards reducing operation costs thus supporting investment plans with confidence.
I. Introduction
Buildings electrical power systems health and people safety are two factors that are always tied together. Furthermore, many electrical codes are developed to enforce safety as one of their main goals [1][2]. In addition, international standards such as IEEE [3] and NFPA [4] have documented valuable calculation methods and guidelines to ensure a safe environment.
Examples of common power studies on commercial buildings can be divided into short circuit studies [5], Arc Flash studies [6], and Coordination studies [7]. With Short circuit studies focus on validating all the electrical equipment kA rating onsite with respect to the fault level coming from the main entrance, Arc Flash studies help workers and site-operators to the suitable PPE (Personal Protective Equipment) while working on certain equipment. Finally, coordination studies usually focus on safely operate equipment in a certain predetermined pattern or sequence.
Steps followed to build a complete power study usually contain a part where specific detailed data should be collected from that site under investigation. Note that, the data collection step should not be considered trivial. In fact, it must be done by experts in the field. Decisions during the data collection step should aim to close the gap between theoretical considerations needed for the calculation step afterward, on one hand, and which data was practically manageable to be obtained from the site understudy, on the other hand. In other words, practically, the data collecting step can lead to different levels of uncertainties, depending on the site. As an example, some of the challenges can be in the form of missing data on nameplates. Figure 1 shows a nameplate of a Transformer where the %Z field is empty. Moreover, some manufacturers display the nameplate data in a certain way that requires a shutdown to be obtained, which is not always an available option when visiting the site. See Figure 2 (b).
Having said that, data collectors usually have to balance between the amount of data per equipment, required accuracy levels, and the site time/space constraints. Space constraints include; occupied spaces, such as in Hospitals; or restricted areas that require specific clearances such as in some government facilities. Moreover, time constraints can result from working in a busy environment, such as industrial factories.
Power studies’ strengths are measured by how much they represent the actual electrical system. Errors in power studies, such as in Arc flash studies, can produce PPE levels that underestimate/overestimate the arc flash duration on a certain bus, for example. This can happen by simply estimating the wrong length of just one cable in the simulated system.
Another accuracy factor, that is neglected by some, is that power studies must follow the exact scenarios onsite. In another way, the study should describe all the possible configurations used on the site under study, including tie circuit breakers status, for example.
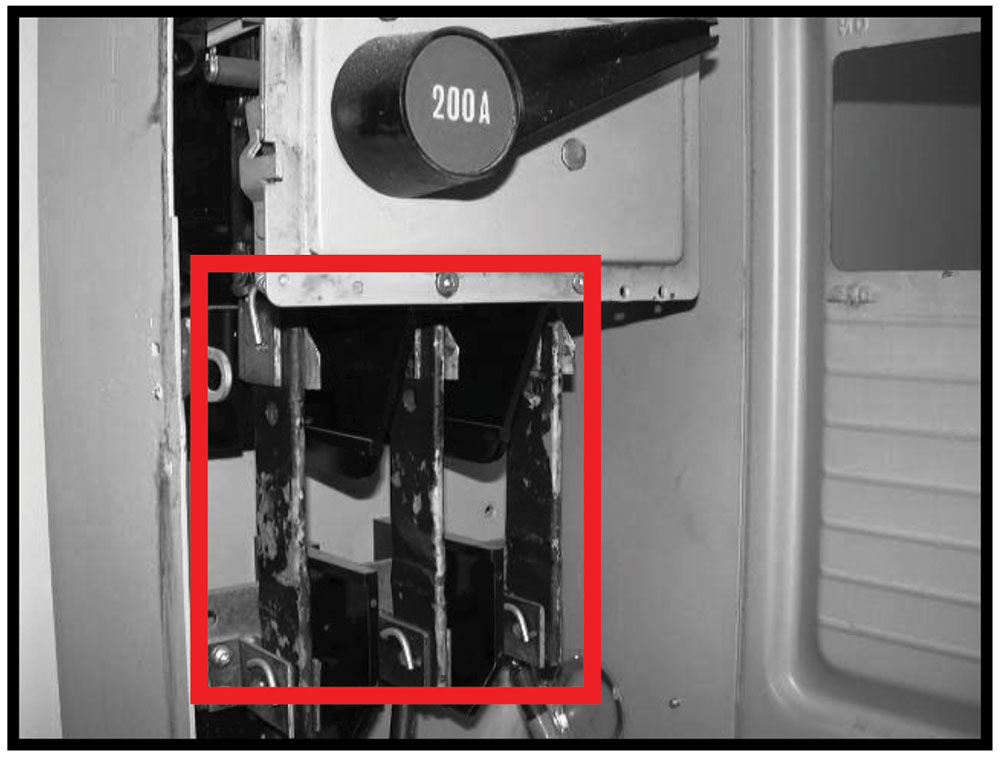
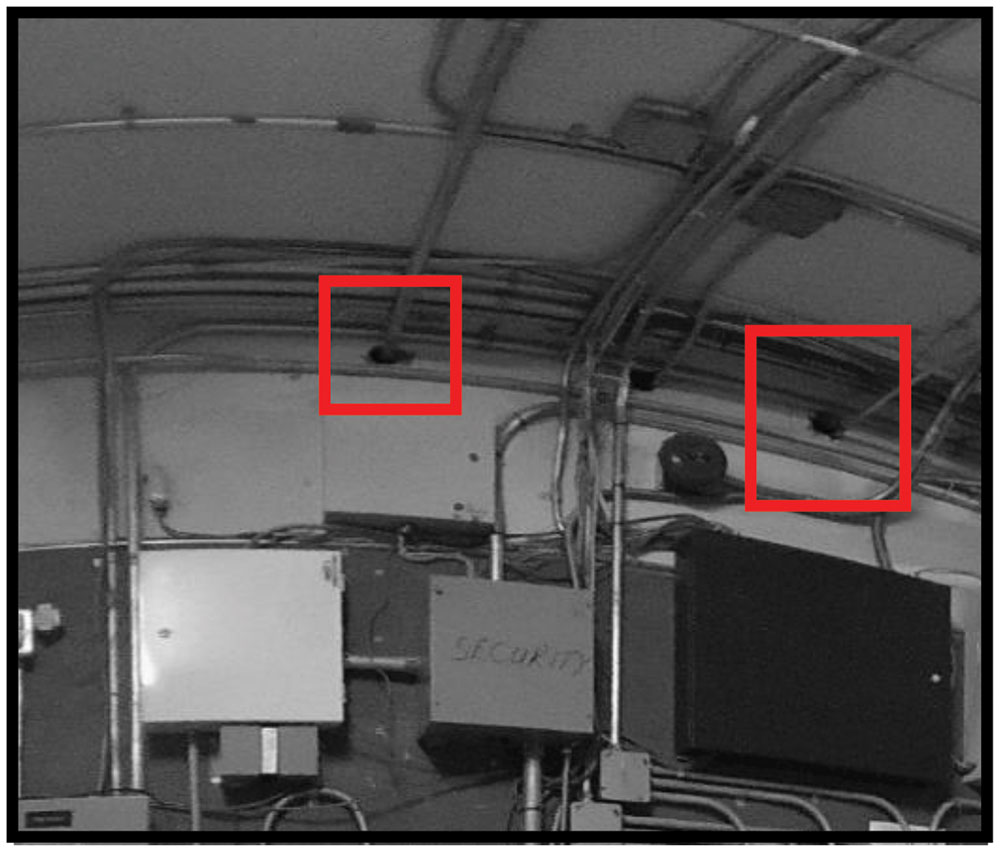
Furthermore, another major point, that is missed by many, is that even that some power studies, such as Arc Flash Studies, are considered valid for a duration of 5 years, the system itself has to be fully maintained for this point to be valid, see Figure 3. In addition, some electrical equipment could have been replaced or modified during that period, which could create greater hazards than what is mentioned in the old study documentations, refer to Figure 4.
Well-maintained sites require following the recommended maintenance procedures such as NICET [8] and manufacture specs. Maintenance can include oil sample tests for transformers, Circuit Breakers lubrication, functional tests, … etc.
Finally, other sources of inaccuracy are related to the software used to model the system, which device libraries were implemented, and the standards adopted. In this work, different factors affecting the strength of power studies, using Arc flash and short circuit studies as an example, will be demonstrated. All the examples, sample pictures and case studies used are from real sites in North America. Note that, all the calculations done are based on IEEE 1584-2018.

II. ARC FLASH AND SHORT CIRCUIT STUDIES
One of the common power studies that is widely performed on industrial sites and commercial buildings is Arc Flash Studies [9]. In general, Arc flash incidents are described as dangerous conditions caused by an electric arc as a result of an electrical fault. Due to the danger these incidents could cause, it is important to have these levels of energy calculated and plans put to try to eliminate and mitigate them if possible. An arc flash can occur in situations such as when personnel, simply, is switching or racking a circuit breaker. Another example could be when maintenance work is being performed on a piece of certain equipment.
Both IEEE 1584-2018 [3] and NFPA 70E [4] have provided detailed calculation guidelines and clear standards to help to calculate the degree of arc flash hazard at given points on the electrical distribution system. The following steps summarize part of the calculations required to obtain the value of incident energy on certain equipment in case of a fault (As adopted in EasyPower V10.0):
First Step: Calculation for Intermediate Average Arcing Current (Iarc)
According to the latest standard of IEEE 1584-2018, and assuming a VCB (Vertical electrodes in a Cubic Box) configuration, the following equations are used to calculate the arcing current at a certain bus (600V in this example)
Iarc= 10(a) (b) (1)
a = k1 + k2 log (Ibf )+ k3 log (G) (2)
b = K4I6bf + K5I5bf+ K6I4bf+ K7I3bf+ K8I2bf+ K9Ibf+ K10 (3)
Where,
Ibf : Bolted fault current for three phase faults (kA)
G: Conductor Gap between the conductors or electrodes (mm)
Iarc: Average RMS arcing current at the voltage level (Voc)
K1 to K10: Coefficients provided in [3, Table 1]
Table 1: Data required by EasyPower for a short circuit and Arc Flash Study
| Equipment name | Required Data |
| Fuse | Type, kA rating, voltage, and current |
| Circuit Breaker | Type, kA rating, trip Unit settings (if any), voltage, and current |
| Disconnect | Type, kA rating, current, and voltage |
| Transformer | Type, Primary and secondary voltage, % Impedance, and KVA |
| ATS/MTS | Type, kA rating, voltage, and current |
| Protection relays | Type, Voltage, current, CT/VT data, and settings |
| Capacitor Banks | Voltage, current, and VAR |
| Cables | Type, Gauge size, and length |
| Motor load | Voltage, current, and HP |
2nd Step: Arcing current Variation Factor – Calculation Arcing Current Variation Correction Factor:
Note that, IEEE 1584-2018 has introduced this new correction factor, VarCf, which will be used to calculate the arc duration, using the reduced arcing current (Iarc_min). Following equations below for the correction factor:

VarCf: Arcing current variation correction factor (kA)
Voc: Open-circuit voltage between 0.208 kV and 15.0 kV
K1 to k7: Coefficients provided in [3, Table 2]
3rd Step: Determine the Incident Energy (I.E)
Where,
E600: Incident energy (J/cm2)
T: Arc duration (ms)
G: Gap distance between the electrodes (mm)
Iarc: Arcing current (kA)
Ibf: Bolted fault current for three phase faults (kA)
D: The distance between the electrodes and calorimeters (mm)
CF: Correction factor for enclosure size
K1 to K13: Coefficients provided in [3, Tables 3, 4 and 5].
When building a power system into software for power studies, designers should be aware of how different parameters can affect the system under study. Furthermore, designers should be aware of various approaches used for different calculations.
For example, before proceeding with an Arc Flash study, Engineers have to obtain the data from both the latest updated SLDs (Single Line Diagrams) and additional onsite data. To develop a full model for an arc flash study, different components should be collected from the site, such as conductor lengths, nameplates, hydro information… etc.
Table 1 shows the minimum data to be collected per equipment for an Arc Flash study when building a model using EasyPower [10].
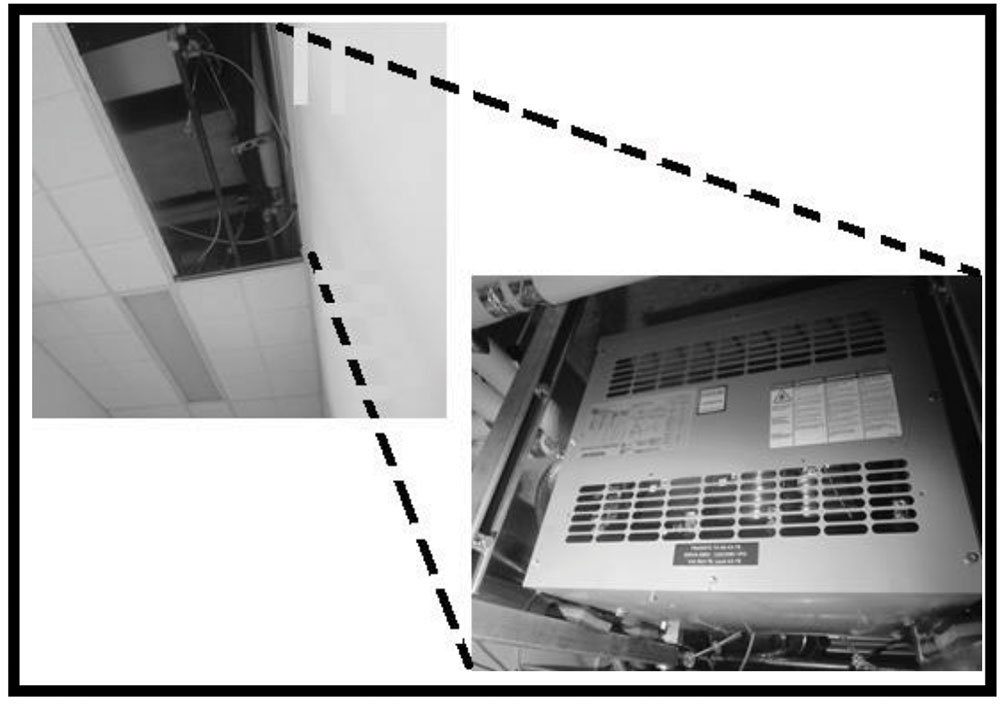
As discussed in the introduction section, visiting sites for data collection can be a challenging task. Figure 5 shows how tracing equipment on-site to help to build the model can lead to hidden spaces, such as this Transformer in the figure. In addition, Figure 6 displays another challenge when estimating cables’ lengths, as it is very common to have cables run into walls before connecting to the next equipment.
With the mentioned challenges, it is important to understand the levels of valid approximation that might be allowed. Furthermore, a balance should be maintained between worst-case scenarios and the reality of the assumption. Note that overestimating the risk could cause more problems than solutions, as it can add levels of discomfort on site.

III. PRACTICAL CASES
In this section, two types of problems that can add uncertainties to Arc Flash/Short circuit studies are presented. The first part will discuss the effect of having inaccurate values for some parameters during the data collection step on the studies, while the second part will discuss one of the problems that can arise when the equipment onsite are not well maintained.
-
Data collection case study
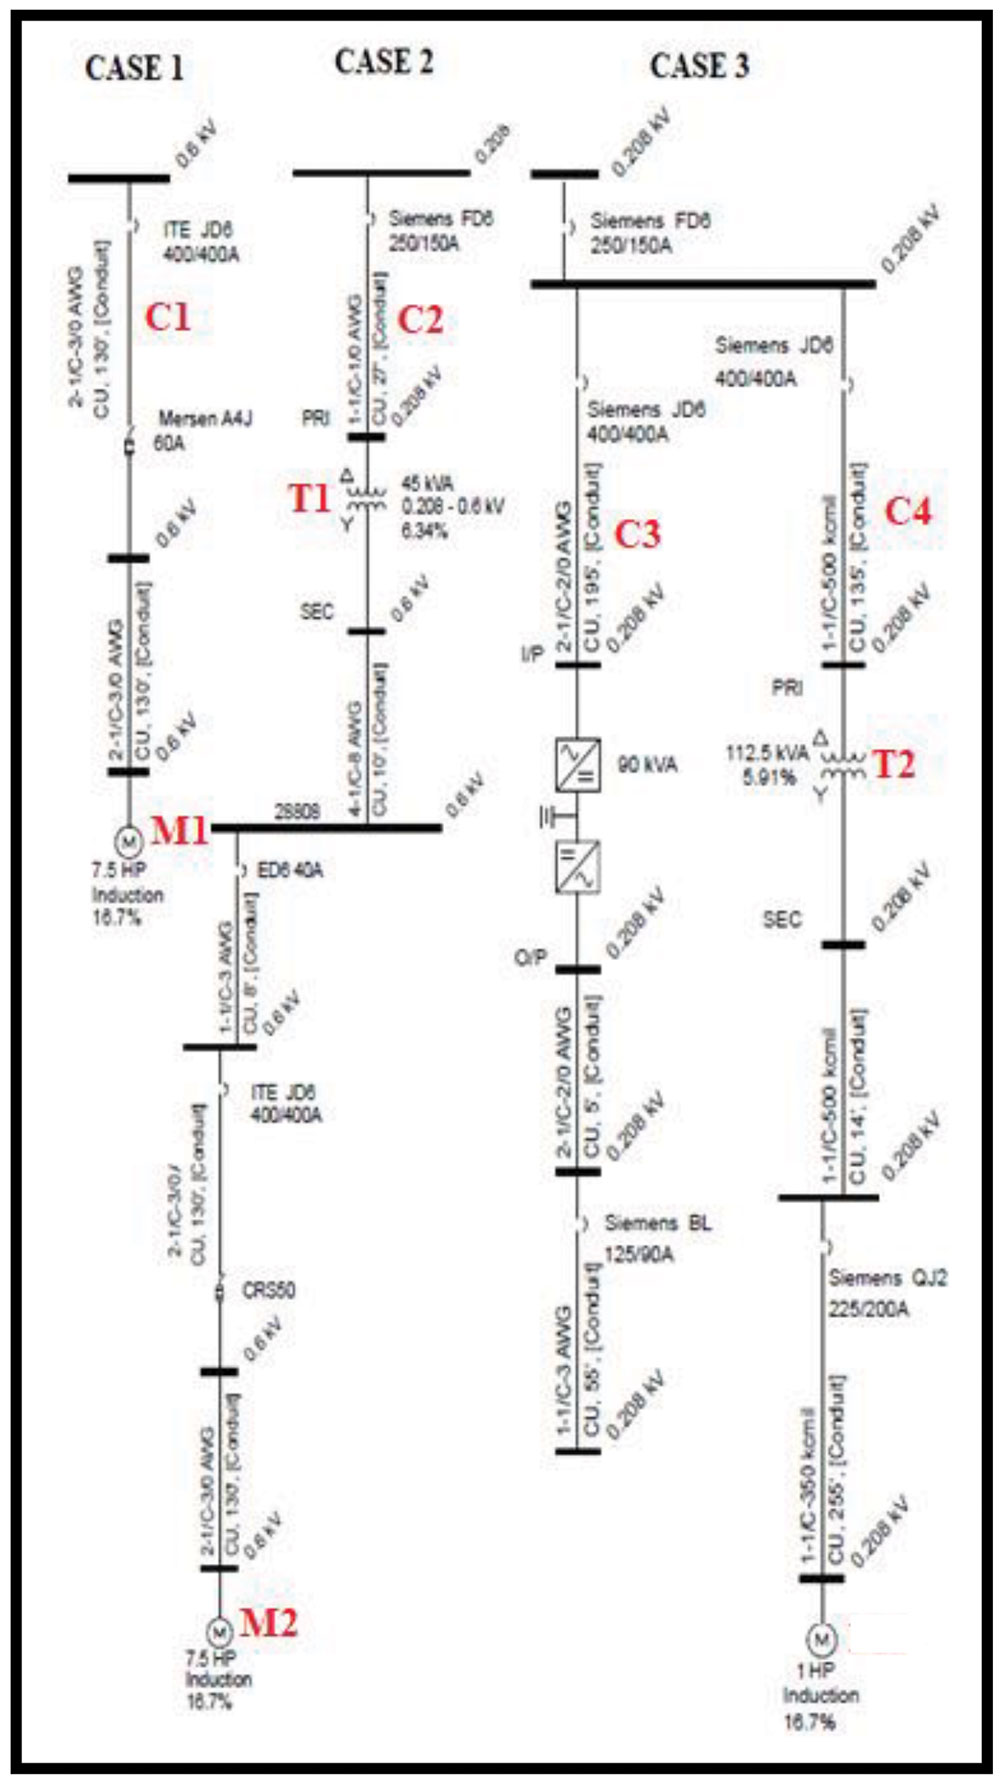
To study the effect of inaccuracy in data collection, three models, namely: Case 1, Case 2, and Case 3 are presented in Figure 7. The system in each model is built and simulated using EasyPower (V10).
Case 1 shows a simple branch starting from a 600V feeder bus through a Circuit Breaker (CB) and down to a motor load (A Fan with 7.5HP in this case). Next is Case 2 where the model has a transformer between the feeder and the loads. Moving to Case 3, which displays a configuration of two branches fed by the Main Circuit Breaker (CB). Note that, the data on each piece of equipment, as shown in Figure 7, is the correct data, as collected and verified from the visited sites.
The objective in this section is to use the three cases in Figure 7 to study the effect of varying some equipment data as part of the data collection step. The focus here will be on three common data collection challenges:
Cable length accuracy (ft), using C1, C2, C3, and C4 in Figure 7.
Transformer %Impedance (%Z), using T1 and T2 in Figure 7.
Load Horse Power (HP), using M1 and M2 in Figure 7.
As mentioned in the previous sections, achieving 100% accuracy, in the data collection step, is not always achievable due to some practical restrictions. Starting with cables, according to ohm’s law, the resistance of the cable is directly proportional to the voltage value and inverse proportional to the current value. Equitation’s below elaborate on this, using a three-phase system as an example:
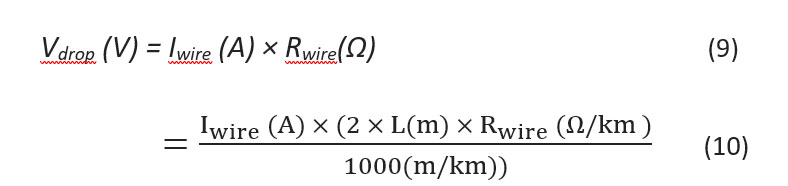
Where;
L: Cable length
Practically, tracking a cable end to end to obtain its accurate length can be time-consuming if not impossible. Alternatively, in some practices, the cable will be assumed to 10 ft (worst case scenario), while in other practices it will be recorded with a certain percentage of error, by counting a number of floors from the feeder to the load, for example. To study the impact of varying cable length values on real-life systems, three cases in Figure 7 are used.
Table 2 displays different percentages of error from different assumptions made on one cable in each case of the figure (C1, C2, C3, and C4). The first column represents the percentage error in reading the cable length followed by two columns per case study (Cases 1,2 and 3), one for the absolute average percentage error (%AE) in short circuit current (Ish), while the other column is the absolute average percentage error (%AE) in Arc-Flash (AF) energy calculation. Note that the %AE values in the table are the result of averaging the error in all the buses in the branch understudy.
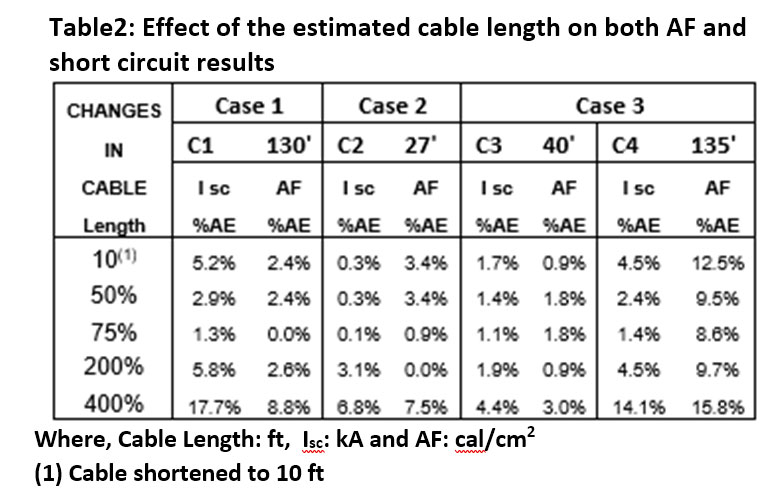
From the results in Table 2, it can be seen that shortening the cable length to 10 ft is one of the best solutions while setting it longer than it is can drop the accuracy to almost 20%.
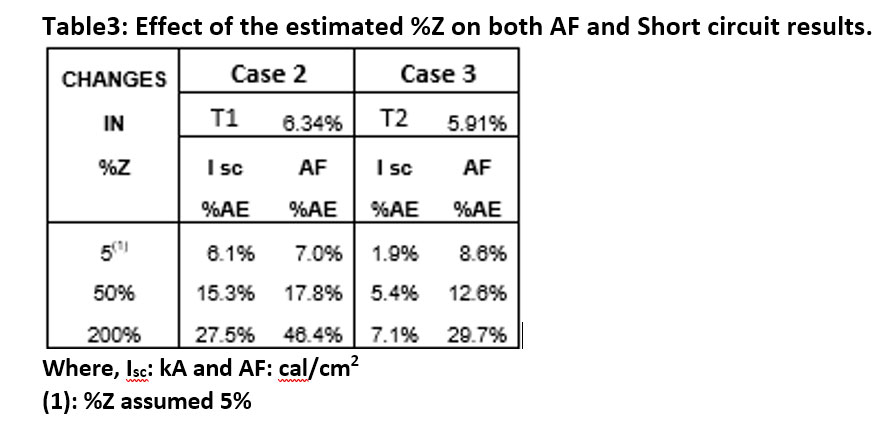
Another possible data collection challenge is obtaining the percent impedance of Transformers onsite. The percent impendence (%Z) represents the percent of rated load impedance possessed by the Transformer according to this relation:
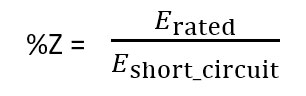
Usually, these values should be printed on the nameplate, but it is not always the case, as shown earlier in Figure 1. While one approach is calling the manufacturer to obtain these values, it is been proven that this practice can cause excessive delays and add extra inaccuracy in some cases. Another used approach in the industry is to approximate the value to 5%. Table 3 shows how varying the value for %Z can affect both Short Circuit and Arc Flash levels on different buses. Note that, in the three cases, using a value of 5% would generate a lower %error.
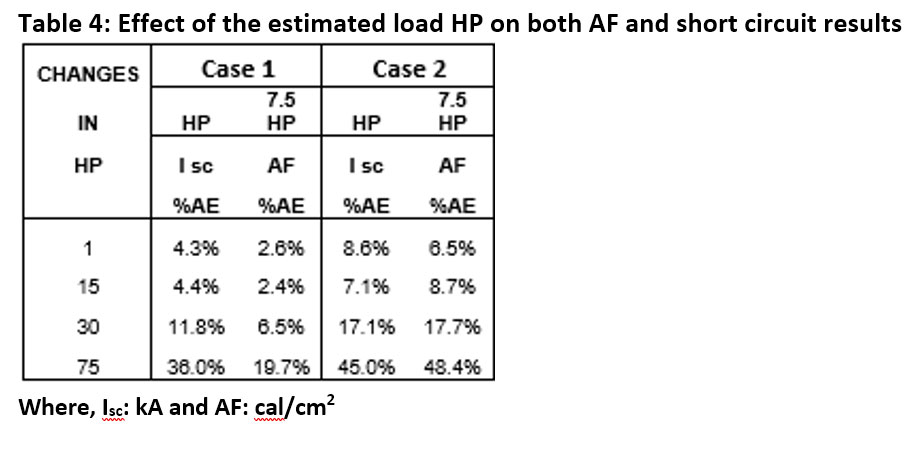
Finally, tracking every single load in a building system can be time-consuming and, in some cases, hard due to various site restrictions (as explained in section I). One common practice can be to approximate each load Horse Power (HP) by examining the feeder current limits and using this formula:
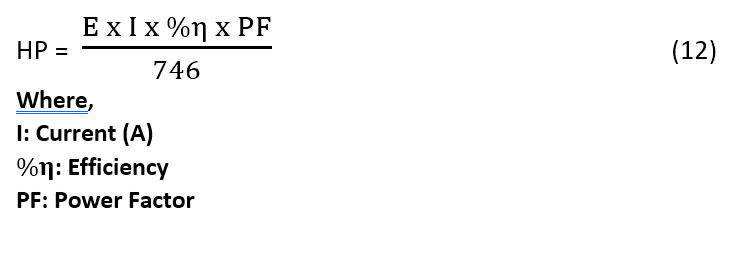
One drawback of using this technique can be that the site under study might not be following safety measures when installing loads, which means that the assumption doesn’t always reflect the correct value. In Table 4, different values of HP from Cases 1, and 2 are presented. It can be seen that errors in obtaining HP values, in the three cases, are more significant when the difference between the actual and estimated values is more than 10HP.
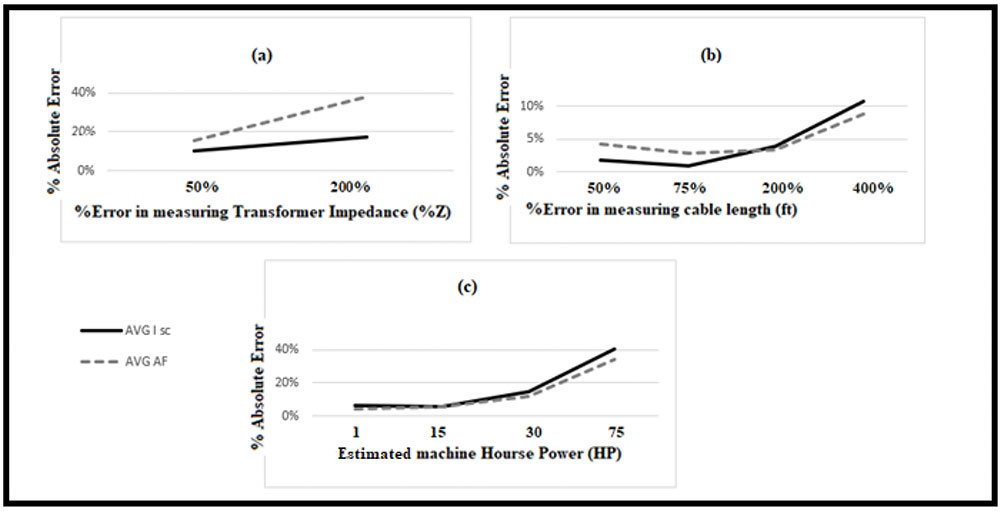
To sum up how the error trends look like using the three presented parameters; Cable length, Transformer %Z, and load HP, Figure 8 displays the results obtained in a graphical approach. The figure is a general representation from cases 1,2 and 3 and can be used just to have a sense of how certain approximations can affect the results when collecting data from a site under study.
B- System maintenance
Dealing with budget constraints, and available resources, many building managers tend to take on a run-to-failure philosophy for equipment maintenance. Having said that, applying such practices can easily result in voiding any performed power studies, regardless of all the details included and standards followed.
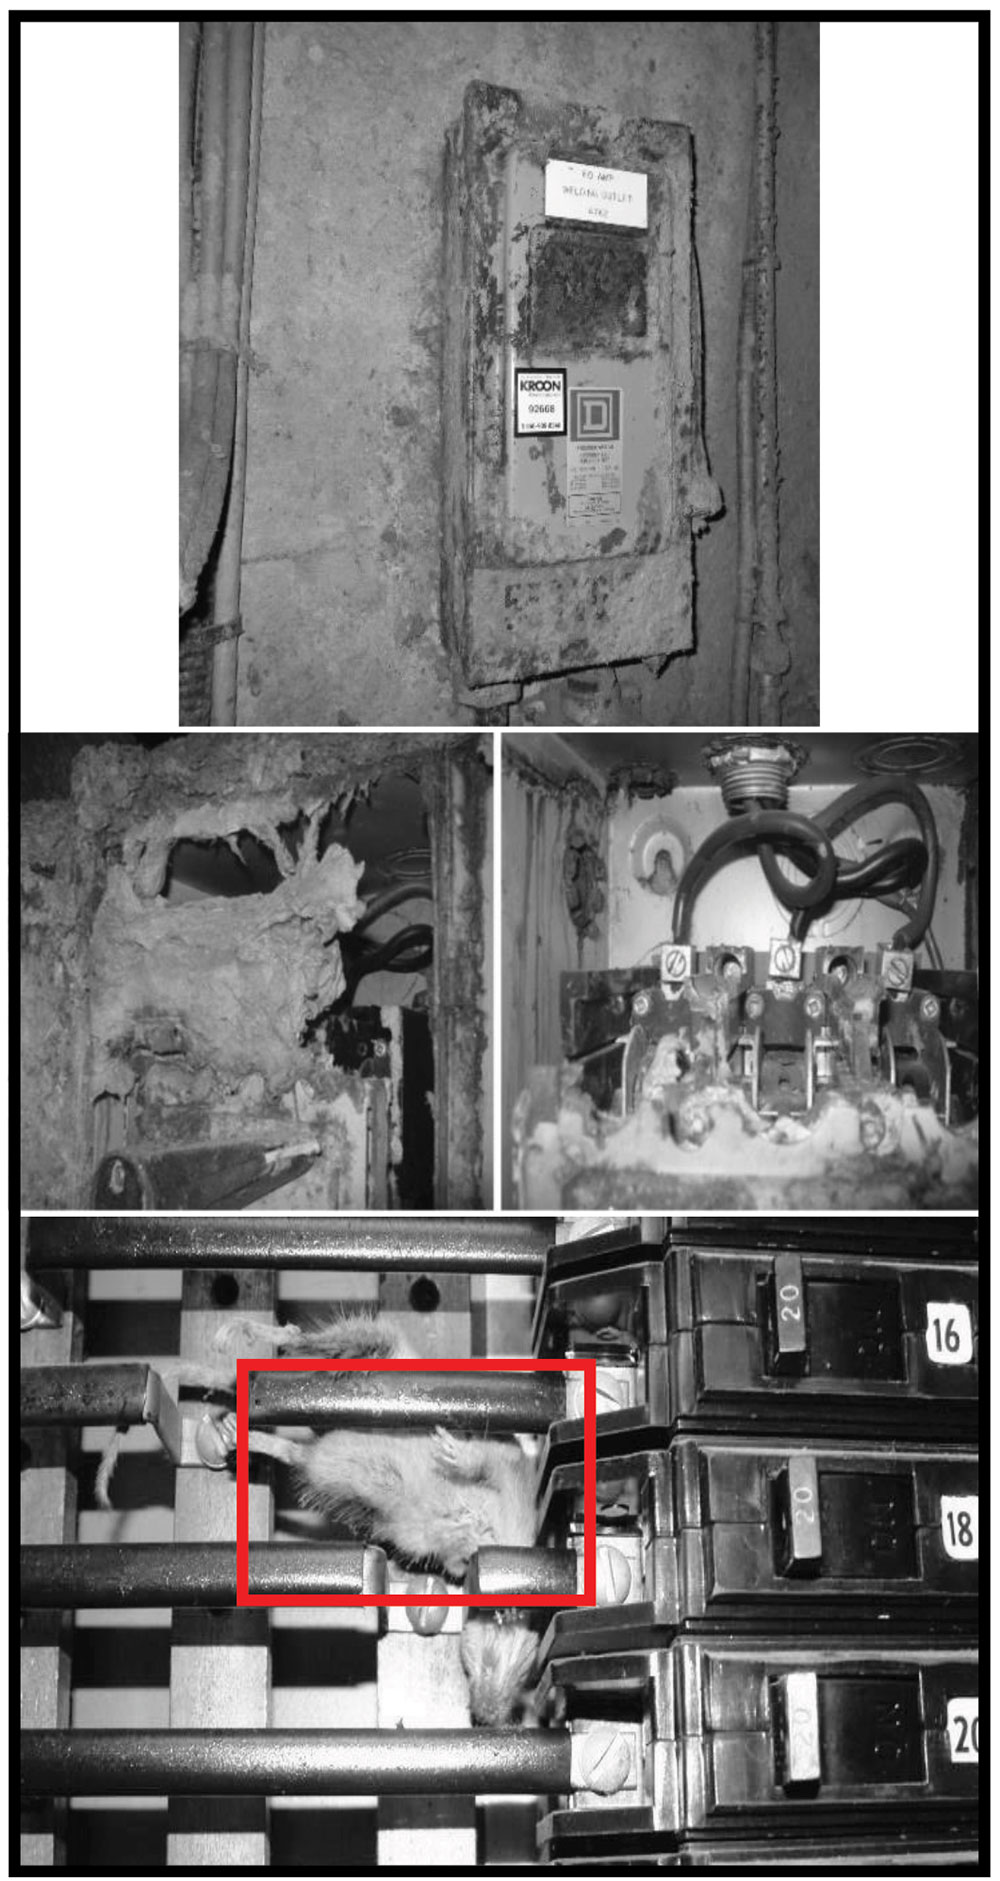
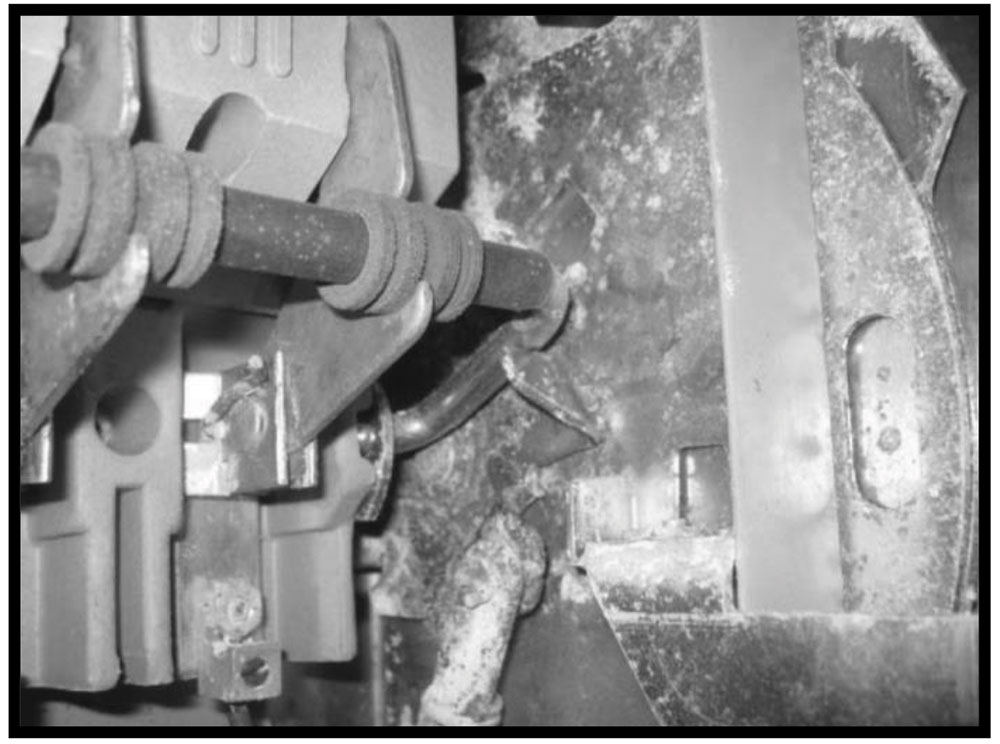
According to the Electrical code [2] and related international standards, different safety procedures should be applied to electrical equipment onsite to ensure a proper functioning system. Taking a molded circuit breaker as an example, regular maintenance is not limited to fixing the trip settings on the display. In fact, it has to cover mechanical inspections (opening and closing hardware within the circuit breaker). According to UL 489 (Standard for Safety) [11][12], periodic testing should be done to avoid cases of failure to open due to a burned-out trip coil, frozen mechanism due to dirt, dried lubricant, or corrosion, see Figure 9. Neglecting the proper maintenance can cause the whole power study to fail to describe the actual performance of the system onsite. Furthermore, safety measures such as Arc Flash Labels placed on the electrical equipment will be all void.
As an example, to demonstrate the harm this neglect can cause, an incident was recorded on one industrial site, where Circuit Breakers haven’t been maintained at all since installation.
According to the data collection step and the simulated model in the Arc Flash study performed, the recommended PPE level was found to be CAT 1 (#1), which requires a long Sleeve Shirt or a Jacket and Pants with a rating of 4 Cal/cm2. [1] Figure 10 and Table 5 show the simulated one-line diagram and related results using EasyPower (V10). Note that selecting IEEE 1584-2018 as the reference standard will automatically apply the equations presented in section II (1-8).

Table 5. The input parameters for a Panel under study, using the theoretical data, as collected from the industrial site understudy.
| Arc Fault Bus Name | 28791 |
| Upstream Trip Device Name | 99601 |
| Equipment Type | Panel |
| Configuration | VCB |
| Bus Bolted Fault [kA] | 16.114 |
| Trip Time [s] | 0.046 |
| Arc Time [s] | 0.046 |
| Incident Energy [Cal/cm2] | 1.2 |
| PPE Level | #1 |
If the results in the Table will be judged with respect to the theory and nameplates data, there will be no doubt that they make sense. As discussed in early sections, there is always a gap between theory and practice that needs to be addressed. In this very example, during a functional test on the Circuit Breaker (99601), it took around five minutes to trip (instead of the 0.046 seconds setting). Calculating the Arc Flash level according to this new fact will clearly result in incident energy in thousands of (Cal/cm2), which is way higher than the Arc Flash label designed for this breaker when the study was done based on the data collection step.
CONCLUSIONS
The discussion and presented case-studies show how the accuracy of the simulated model can affect the results of power system analysis. The paper illustrated more on what does the term “Accuracy” mean when talking about data collection and introduces some of the common challenges when collecting data onsite. Furthermore, having an acceptable level of details about each equipment including nameplates, maintenance profile and type availability in the used software libraries all have to be addressed before making further decisions on the targeted model.
The paper starts with the importance of the data collection step and provides examples of challenges facing data collectors. In section III, three models in Figure 7 are used to show how some parameters such as; the cable length, the Transformer data, and the load HP values can affect final results, thus has to be performed based on an overall evaluation of the system.
In the last section, the discussion focuses on how applying proper equipment maintenance, and performing a thorough equipment check can contribute to the safety onsite and strengthening the study results and recommendations.
REFERENCES
[1] Workplace Electrical Safety, CSA Z462-18, 2018.
[2] Canadian Electrical Code, Part 1 (24th Edition), Safety Standard for Electrical Installations, CSA C22.1-18, 2018.
[3] IEEE Guide for Performing Arc-Flash Hazard Calculations, IEEE 1584-2018, 2018.
[4] Standard for Electrical Safety Requirements for Employee Workplaces, NFPA 70E-2000, National Fire Protection Association, 2000.
[5] A. Berizzi, S. Massucco, A. Silvestri and D. Zaninelli, “Short-circuit current calculation: a comparison between methods of IEC and ANSI standards using dynamic simulation as reference”, IEEE transactions on industry applications, vol. 30 no. 4, pp.1099-1106, 1994.
[6] Carl J. Spezia, “A survey of arc flash computation methods and mitigation strategies”, Journal of Industrial Technology, vol. 26, no. 2, April 2010.
[7] M.F. Kotb, M. El-Saadawi and E.H. El-Desouky, “Protection Coordination Optimization for FREEDM (Future Renewable Electric Energy Delivery and Management) System”, Journal of Electrical Engineering, vol. 6, pp.161-76, 2018.
[8] National Institute for Certification in Engineering Technologies
[9] J.C. Burlingame, “Arc Flash and the importance of conducting studies”, 2019.
[10] EasyPower LLC, EasyPower, V10.0. Tualatin, Oregon, USA, 1984-2021.
[11] Molded-Case Switches and Circuit-Breaker Enclosures, UL 489 Molded-Case Circuit Breakers, 10th Edition, Underwriters Laboratories, pp. 48. 2006.
[12] Maintenance of Electrical Systems, CSA Z463-18, 2018.