New requirements for ampacity correction factors for conductors installed in conduits on rooftops were introduced in the 2008NECat Section 310.15(B)(2)(c). This new requirement for ampacity correction due to ambient temperature resulted from extensive study and fact-finding efforts that collected data which demonstrated valid concerns about excessive heat exposure for conductors and cables installed on rooftops exposed to sunlight. These studies clearly warranted new requirements for ampacity correction factors for such installations. In our wiring methods of conduit, tubing, and cables that are on rooftops and exposed to direct sunlight, temperature value factors are now required to be incorporated and vary based on the height the wiring method is installed above the roof surface.
For example, if a conduit is installed 300 mm (12 in.) above a rooftop in an anticipated ambient temperature of 122°F, then 30° is required to be added to that ambient temperature in which the conduit is installed. In this case, the value of 152°F must be used for temperature correction factor application adjustments from the applicable table at the bottom of Table 310.16, etc.
IAEI has received several inquiries since this newCoderequirement became effective. In keeping with the wiring method theme of this issue, we thought it would be a good time to revisit an article that appeared in the January-February 2006 issue ofIAEI News.
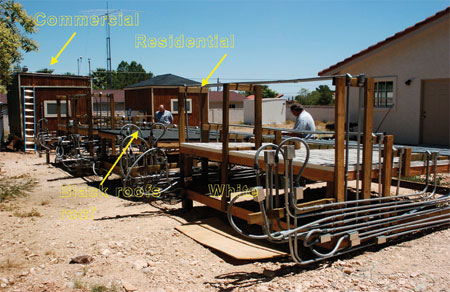
Photo 1. Simulated commercial and residential buildings and simulted roof sections
This article answers a lot of the “how” and “whys” of these new rooftop requirements. At the time the article was first published inIAEI News, these temperature adjustment factors were not a part of the Code other than in suggestive language found in a fine print note at Section 310.10 in the 2005 edition of the NEC.
Full details of these studies are contained in the test report entitledEffect of Rooftop Exposure on Ambient Temperatures Inside Conduits, November 2005.
Abstract
The interiors of conduits in sunlight, such as those containing conductors feeding air conditioning units on rooftops, become significantly hotter than the outside air (which is always measured in the shade). Data show that these temperature differentials can easily reach 70°F, even when the conductors are electrically unloaded. Remarkably, the differentials were found to be essentially independent of the outdoor temperature all through the range from 70°F to above 100°F.
To determine the need for ampacity corrections, these temperature differentials need to be added to the outdoor temperatures, which reach 90°F or higher in most areas of the USA during the summer months. These corrections should be made to the conductors, but seldom are, according to rules in effect in the National Electrical Code.
As might be expected, the temperature differential decreases the further above the roof the conduit is placed. So, for example, when summer temperatures reach 95°F in Chicago, the interior of a conduit lying directly on a roof might be 165°F, while the temperature in a conduit 12 inches above the roof might be 125°F. Interestingly, because light-colored roofs reflect more heat back onto the conduits than dark roofs, their conduit interiors are hotter at heights more than an inch or so above the roof.
Specific temperature adjustments to be added to the design outdoor temperature for any given location are suggested. These adjustments range from 60°F for conduits lying directly on a roof to 25°F for those 36 inches above a roof.
Introduction
Ambient Temperature Corrections
Recent research challenges accepted practices derived from the U.S.National Electrical Code(NEC)1 regarding ambient temperature corrections for building wire. In practice these corrections are seldom made, due in part to a lack of accepted data on what the temperatures in various spaces actually are.
As the temperature of a metallic conductor increases, its ampacity, or current-carrying capacity, decreases due to the accompanying rise in electrical resistance. This occurs with either copper or aluminum. Certain tables and equations in theNECare intended to make the necessary ampacity corrections for elevated ambient temperatures in the spaces surrounding conductors. Table 310.16 is especially relevant. When a downward ampacity correction is made, the conductor is said to have been “derated,” sometimes requiring a larger-size conductor to carry the expected current.
Failure is defined as exceeding the temperature rating of a given cable, as pointed out clearly inNECArticle 310.10: “In no case shall conductors be associated together in such a way, with respect to type of circuit, the wiring method employed, or the number of conductors, that the limiting temperature of any conductor is exceeded.”
Though not specifically defined in theNEC,the ambient temperature for a conductor is generally agreed to be the temperature of the air surrounding it.In the case of conductors inside a conduit, the air inside the conduit represents the ambient conditions of interest.
Conduits in direct sunlight on the flat rooftops of commercial and industrial buildings are a common occurrence in many areas.
Intuitively, one would expect that the temperatures inside these conduits would be considerably higher than outdoor temperatures, but research was needed to determine exactly how large the temperature differentials are. Once these temperatures were known to a reasonable accuracy, derating calculations could be made, preferably based on known outdoor temperatures in various locations of the country. TheNECat present contains no rules specifically directed at derating conductors inside conduits due to heating by sunlight.
Since many variables might influence these conduit temperatures, such as the color and texture of a roof, how high above the roof the conduit is placed, the material used in the conduit, the latitude of the location in question and the time of year, research was also needed to determine the influence of these factors.
Needless to say, summer would be expected to produce the hottest temperatures and climates with clearer skies, such as desert locations, should have more days of high temperatures. Design for safety, however, should be based on worst conditions. Even though a location is cool or has cloud cover or is windy most of the year, if it experiences hot summer weather, derating of conductors may be required.
On behalf of U.S. wire and cable manufacturers and users, Copper Development Association has undertaken a research program to determine the temperatures inside conduits on rooftops. Based on early results of the work,2 a 2005 NEC fine-print note was added as 310.10, FPN No. 2: “Conductors installed in conduit exposed to direct sunlight in close proximity to rooftops have been shown, under certain conditions, to experience a temperature rise of 17°C (30°F) above ambient temperature on which the ampacity is based.” It was pointed out by the code panel that important data were missing that would allow this or a similar provision to be accepted as required language in the NEC. At the time, extensive data on the effect of height above the roof, roof color, conduit type and other parameters were not available, and the code panel was reluctant to allow this or a similar provision to be accepted as required language in theNEC. Current research addresses these issues, and is discussed in these findings.
Outdoor Air Temperature
Since the main purpose of this research was to determine the “temperature adjustment” that needs to be added to the expected outdoor temperature for a given location, it is important to use an accepted number for the outdoor air temperature itself. Remember that“official” outdoor temperatures are always measured in the shade.
ASHRAE Data. Fortunately, the American Society of Heating, Refrigerating and Air-Conditioning Engineers, Inc. (ASHRAE) deals with outdoor temperatures in order to design heating and air conditioning systems. ASHRAE has developed a weather data base, including outdoor design temperatures, for 753 locations in the United States, and 4,422 worldwide. 3
Since temperature corrections for cable inside conduit only relate to hotter weather, only the cooling side of the design process will be considered here. It is quite important in properly sizing an air conditioning system to use a statistically valid number for the high temperatures reached in the summer in any location. These data are originally compiled by the National Climatic Data Center (NCDC), a subsidiary of the National Oceanic and Atmospheric Administration (NOAA), and both are part of the U.S. Department of Commerce. The ASHRAE data base covers thirty years (1972 – 2001) of hourly temperature readings at these locations.
In northern locations, June, July and August are generally considered the cooling season — a total of 2,208 hours. For the Sunbelt states, May and September are usually added, for a total of 3,672 hours in the cooling season. ASHRAE publishes both annual and monthly tables listing expected design temperatures based on three criteria: 0.4%, 1% and 2%. The first means that, for the hourly temperature readings that are collected and compiled, 0.4% of those readings are expected to be above the design value. In other words, using the monthly design values, the temperature in a typical summer will exceed the design temperature for 9 of the 2,208 hours in June through August, or for 15 of the hours for May through September. In the case of the 1% design criterion, the hours exceeding the limit are 22 hours and 37 hours, respectively. For the 2% criterion used here, they are 44 and 73 hours, respectively.
Any of the three criteria constitute valid design, but ASHRAE warns against overly aggressive assumptions (temperatures too close to the maximum). Such assumptions, in conjunction with other safety factors that are built into the air conditioning design process, can lead to seriously oversized AC systems. The result is that, in humid areas, the system doesn’t run enough hours to properly perform its secondary purpose of dehumidification. Such oversized systems also use more energy, even if units with high SEER or EER ratings are specified.
Therefore, it is proposed that the 2% rule be applied by electrical designers for purposes of determining summer outdoor temperatures for design purposes. This has the major advantage of simplicity, since the number can readily be obtained for a given area. Also, a given temperature can often be used over the entire working territory for a given designer, installer or inspector of rooftop conduit systems.

Table 1 shows some typical data from ASHRAE and NCDC sources for the summer temperatures for design purposes using the 2% rule for selected locations, as well as the highest temperatures on record for those locations.
Several conclusions can be drawn from table 1. First, the design temperatures are significantly lower than the record high temperatures, usually by 10 – 20 degrees. Notable exceptions are the Florida cities and Honolulu where, surprisingly, outdoor temperatures have never reached 100°F. Second, more than 75 percent of the cities listed in table 1 have 2% design temperatures of 90°F or higher.
In fact, the 2% design temperatures shown in table 1 are a couple of degrees low, for two reasons. First, ASHRAE estimates that, if temperatures in their data base were recorded more often than hourly, the highest temperatures would typically be found between the hours, and they estimate that true design numbers would be about 1°F higher for the summer months. Second, the process used here was to average the available monthly 2% readings for June through August, or for May through September, rather than compiling a 2% value for all those months from a single data set (which was not available). This probably resulted in lower numbers, by about another 1°F.
Solar Radiation
In approving an FPN, a fine-print note, for the 2005NEC, code panel 6 cited the need to show that data collected in a hot climate (Las Vegas, Nevada) could be related to other areas. In fact, Las Vegas is a particularly good test site because its high number of clear days per year, and broad range of solar radiation intensities and temperatures (in different seasons), allow for good correlation of data with cities throughout the USA.
The relevant climatic property is solar radiation. Data are available for various orientations of solar collectors for various stations from the National Renewable Energy Laboratories (NREL).5 Collectors are oriented at various angles to the sun but, since commercial and industrial roofs are flat, or nearly so, the relevant orientation for the collector for this purpose is horizontal.
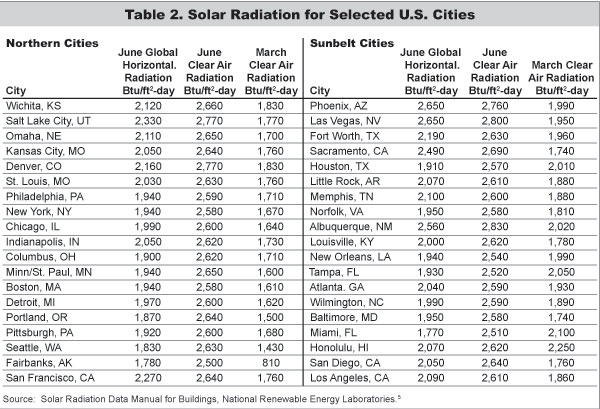
Table 2
Table 2 shows solar radiation data for the same cities, arranged in the same order, as table 1. Table 2 is a com-pilation of the actual data from June, averaged over a 30-year period, followed by the clear air value for June and the clear air value for March as a comparison, when the sun is lower in the sky. All units are in Btu’s per horizontal square foot per day.
Several conclusions can be drawn from table 2. First, the variation between locations on a clear day is remarkably small in June, when the sun is highest in the sky. The value for Las Vegas is 2,800, while for the other end of the spectrum in Fairbanks, Alaska, it is 2,500. During other months, the differences are much greater. For March, for instance, Las Vegas measures 1,950 on a clear day, while Fairbanks is only 810. Second, Las Vegas in March has a much lower value than any city in the table in June. This tends to support the conclusion that tests run in Las Vegas in the spring involve less heating from solar radiation than many other cities in the summer on a clear day.
Of course, not all days are clear, and this is shown by the actual June readings versus the clear air readings for cities like Seattle (1,830 vs. a theoretical 2,630). Nevertheless, all cities have many clear, sunny days during the summer months and proper design must account for this.
Related Applications. Formulas exist in other electrical applications, such as in the design of overhead cable to IEEE standards, to use solar radiation data to determine ampacity.6, 7 These standards and methodologies all assume constant solar radiation conditions anywhere in the USA. One landmark paper states that the use of 900 W/m2 “… is typical of conditions that exist on a bright, sunny mid-summer day throughout most of the United States …” 8 This confirms the data in table 2 showing minimal variation from location to location.
Wind. One concern voiced by members of NEC panel 6 to the use of data derived in Las Vegas for other locations was that some locations experience significant winds a good percentage of the time. However, the wind is not always blowing on a hot day in any location, so this argument should be rejected. The IEEE working group for Standard 738, in fact, recommended that wind not be taken into account in designing overhead cable because of its sporadic nature.6
Experimental Procedure
The experiments are being conducted at a Las Vegas, Nevada, research site consisting of a 10-foot by 12-foot simulated residential building, a 10-foot by 12-foot flat-roofed commercial-type building, and simulated roof sections adjacent to these buildings (photo 1). The work began in 2002 and has moved through several phases. Construction details are available on request. Temperatures are measured using Type T copper-constantan thermocouples. The thermocouple wires are routed back to a multiplex unit and computer inside the commercial building where all temperatures are recorded at one-minute intervals throughout the day and night. The temperature measurements actually retained and used are 15-minute averages; therefore, each such data point is an average of 15 readings.
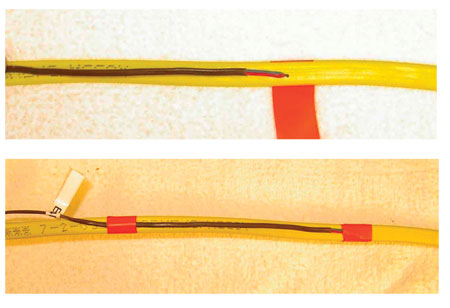
Photo 2. Temperature measurements taken on outside of insulation of individual conductors
The temperatures reported in these findings are measured on the outside of the insulation of individual conductors in the conduits. The conductors are not carrying current. Photo 2 shows how the thermocouple is attached. The research also measures temperatures on the inside walls of conduits, on roof sheathing, under mineral roll roofing materials and in various other locations.
Simulated roof sections shown in photo 3 were covered with three types of roofing surfaces: black mineral roll roofing, white mineral roll roofing and mineral roll roofing painted with a white elastomeric coating. The latter is a brighter, more reflective roof surface than the uncoated white roll roofing.
Three-quarter-inch electrical metallic tubing (a common kind, known as EMT) conduit samples and rigid nonmetallic conduit, known as RNC, were used in the experiments. Each contains three AWG 12 THHN copper conductors — one with either black, blue, or red insulation, one with white insulation, and one with green insulation — arranged at seven different heights above the black and white roll roofing (photo 4). These heights were as follows: lying directly on the roof, on struts 5/8″ above the roof, and at heights of 1.5″, 3.5″, 6″, 12″ and 36″ above the roof. The white elastomeric-coated roof had samples only at the 3.5″ height.
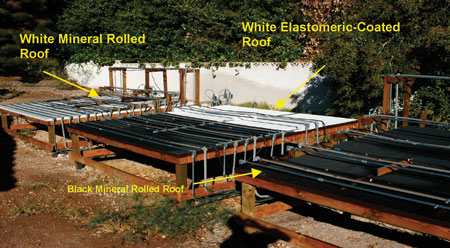
Photo 3. Roof surfaces cover range of reflectivity from very white to black
For the portion of the experiment reported on here, all the conductors were electrically unloaded. Temperature sensors were taped to the insulation of the phase conductors (black, blue or red) at the center of each length of conduit. In order to confirm that this is a fair representation of the ambient temperature in a conduit, sensors were also placed on the top and bottom inside surfaces of the conduit, and in the free air space of a few samples not containing conductors. All temperature readings in these instances were within a degree or two of each other, and so the sensors on the phase conductors were accepted as an accurate representation of the ambient temperature in the conduits. This would not be an acceptable measurement of ambient temperature, of course, had the conductors been electrically loaded.
Note that the rooftop data reported in this paper represent temperaturedifferentials, not actual temperatures inside the conduits. The differential is derived by subtracting the measured outdoor temperature from the measured temperature inside the conduit for each time recorded.
Results
The following are the main results of the experiment.
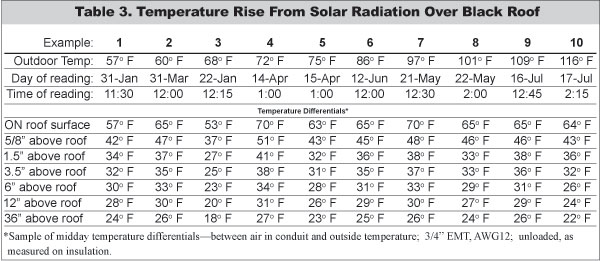
Table 3
Solar Effect.
Under all conditions tested, from outdoor temperatures ranging from 50° to 116°F in all seasons of the year, and heights above the roof ranging from 0″ to 36″, temperatures inside unloaded conduits in direct sunlight are considerably higher than outdoor temperatures. A random compilation of midday temperature-rise data under a wide variety of outdoor temperatures and seasons is shown in table 3.
Statistical Basis. Results of the rooftop experiments may be reported in several ways. For a given parameter, such as height above the roof, where there are many hundreds of readings, the maximum value could be shown, the average or median value could be shown, or some percentile could be used so as to avoid extreme cases. It was decided to use the same principle used by ASHRAE, namely a percentile approach. This is used to specify design outdoor temperatures and will also be used here for temperature rises. The ASHRAE percentile used for outdoor temperature is the 2% level, meaning that 2% of the numbers in a given data set lie above the design number chosen. For temperature rises a more modest 10% level is proposed, since the data base here is not as large as the ASHRAE temperature data base.
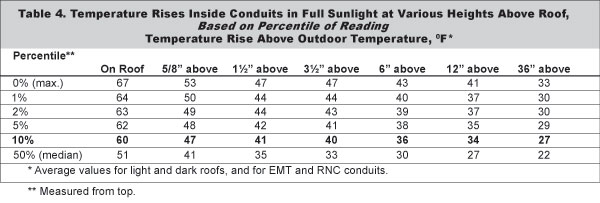
Table 4
For the full range of results, for both EMT and RNC, and for both dark- and light-colored roofs, the various percentiles are shown in table 4.
At all heightsabovethe roof the 10% value is 6–7 degrees Fahrenheitbelowthe maximum value, and roughly the same above the median value. This would tend to support the argument that it is a reasonable design criterion.
Distance Above Roof. The temperature rise within a rooftop conduit in full sun decreases as the distance above a roof surface increases from 0″ to 36″. The most dramatic temperature increase takes place for conduits lying on the roof, which had solar increases as high as 70°F (table 3), while the median value for all roof surfaces and conduit types was 51°F (table 4). These numbers drop sharply at the 1-½ inch height, then gradually decrease further to 36 inches above the roof surface.
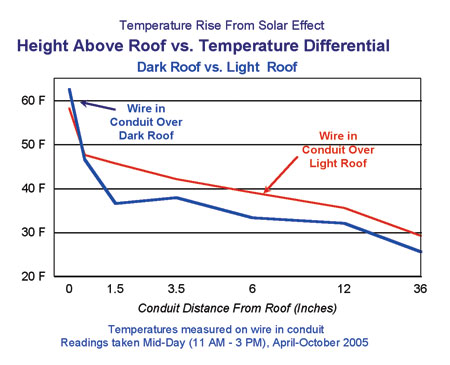
Figure 1. Temperature rise as a function of roof color
Roof Color.
Temperatures inside conduits over dark-colored roof surfaces are higher than over light-colored surfaces if the conduits are on or quite close to the roof, as shown in figure 1. For distances greater than about an inch above the surface, and continuing until at least 36″, conduits over light surfaces are hotter, due to the higher reflection of heat from the light surface.
It should be noted that, especially in hotter climates, light-colored roof surfaces are recommended because of their ability to keep a building’s interior cooler.9
This has the unintended effect of increasing the temperature burden on conductors in rooftop conduits in locations with the most severe summer temperatures.
The combination of the two previous points — distance above roof and roof color — means that temperatures inside conduits over light-surface roofs consistently maintain a higher temperature differential than over dark-surface roofs, from 1 inch through 36 inches above the roof.
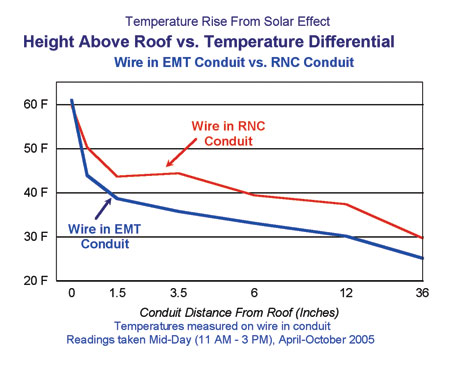
Figure 2. Temperature rise as a function of conduit type
Type of Conduit.
Figure 2 shows that temperatures in-side RNC conduits tend to be hotter than is the case with EMT conduits. This is undoubtedly due to the darker color of RNC, which tends to darken considerably more with exposure to sunlight, as compared to the bright, reflective surface of EMT.
Outdoor Temperature Range.Table 5 shows the data arranged by outdoor temperatures. It shows a remarkable consistency in temperature rise no matter what the outdoor temperature is. In fact,the data indicate that outdoor temperature is a minor factor in determining what temperature to add to it to determine the need for derating.
Locations Other Than Rooftops. Ongoing work is proceeding on the effects of locating cables or conduits in full sunlight in various orientations other than horizontally above a flat roof. This could lead to future Code proposals.
Conclusions
Attention should be paid by those designing electrical systems for commercial, industrial and other flat-roofed buildings to potential problems caused by the presence of conductors inside conduits located outdoors in direct sunlight. This condition often causes a need for derating, which is seldom done in practice.
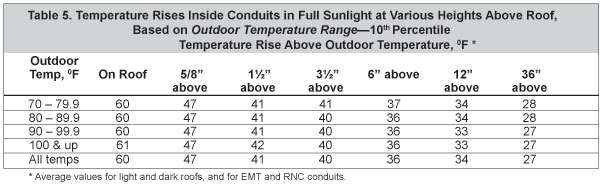
Table 5
The air inside conduits in direct sunlight gets significantly hotter than the surrounding air, and designers need to make appropriate ampacity corrections. Although light-colored roofs reflect more heat than dark roofs and keep their buildings cooler, some of that heat is reflected to the conduit above the roof, making the air in the conduit generally hotter. Data from the experiment suggest that temperature rises in conduits over roofs of any color can be considered roughly equivalent, so there is no need to make distinctions for derating purposes.
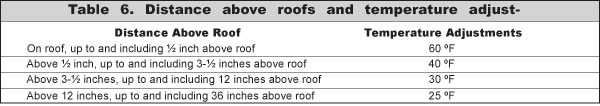
Table 6
Neither is there a need to make distinctions based on the level of outdoor temperatures. Temperature rises are remarkably constant no matter whether the outdoor temperature is in the 70s or the 100s.
References
1 National Electrical Code, NFPA 70, National Fire Protection Association, 772 pp (2005). Code articles of particular interest in paper are 310.10 and 310.15.
2 Lindsey, T.C. and W.T. Black, “Ambient Temperature Ampacity Corrections for Cable Bundling and Direct Solar Exposure,” IAEI News, 75(5), 40-48 (September/October, 2003).
3 2005 ASHRAE Handbook – Fundamentals, American Society of Heating, Refrigerating and Air-Conditioning Engineers, Inc. including worldwide data tables.
4 National Climatic Data Center, National Environmental Satellite, Data and Information Services.
5 Solar Radiation Data Manual for Buildings, National Renewable Energy Laboratories (NREL).
6 IEEE Standard for Calculation of Bare Overhead Conductor Temperature and Ampacity Under Steady-State Conditions, ANSI/IEEE Std 738-1986.
7 IEEE Standard Power Cable Ampacity Tables, IEEE Std. 835-1994.
8 Hartlein, R.A. and W.Z. Black, “Ampacity of Electric Power Cables in Vertical Protective Risers,” IEEE PES Summer Meeting, 1982.
9 Parker, D. S., J.K. Sonne and J.R. Sherwin, “Flexible Roofing Facility: 2004 Summer Test Results,” Florida Solar Energy Center, prepared for U.S. Department of Energy Building Technologies Program, July 2005, 23 pp.